XAUUSD
4101.96

0.09%

WTI
93.602

0.45%

EURUSD
1.11830

0.25%

GBPUSD
1.32176

0.19%

USDJPY
158.024

0.19%

USNDAQ100
29756.40

0.62%

Global Markets

Economic Calendar
7x24
Quotes

Video

Latest Update

Risk Warning on Trading HK Stocks

Despite Hong Kong's robust legal and regulatory framework, its stock market still faces unique risks and challenges, such as currency fluctuations due to the Hong Kong dollar's peg to the US dollar and the impact of mainland China's policy changes and economic conditions on Hong Kong stocks.

HK Stock Trading Fees and Taxation

Trading costs in the Hong Kong stock market include transaction fees, stamp duty, settlement charges, and currency conversion fees for foreign investors. Additionally, taxes may apply based on local regulations.

HK Non-Essential Consumer Goods Industry

The Hong Kong stock market encompasses non-essential consumption sectors like automotive, education, tourism, catering, and apparel. Of the 643 listed companies, 35% are mainland Chinese, making up 65% of the total market capitalization. Thus, it's heavily influenced by the Chinese economy.

HK Real Estate Industry

In recent years, the real estate and construction sector's share in the Hong Kong stock index has notably decreased. Nevertheless, as of 2022, it retains around 10% market share, covering real estate development, construction engineering, investment, and property management.

Analysis
Data

Data Warehouse Market Trend Institutional Data Policy Rates Macro

Market Trend

Speculative Sentiment Orders and Positions Correlation

Popular Indicators

Pro
AI Signal

Trading Signals

AI Signal

News
Recent Searches
    Trending Searches
      News
      7x24
      Quotes
      Economic Calendar
      Video
      Data
      • Names
      • Latest
      • Prev.

      View All

      No data

      Sign in

      Sign up

      --

      • My Favorites
      • My Subscription
      • Profile
      • Orders
      • Account Settings
      • Sign out
      Reminder Settings
      • Economic Calendar
      • Quotes/Market Quotes

      Reminders Temporarily Unavailable

      FastBull Membership Privileges
      Quick Access to 7x24
      Quick Access to More Editor-selected Real-time News
      Real-time Quotes
      View more faster market quotes
      Upgrade to {0} Pro
      I have read and agreed to the
      Pro Policy
      Feedback
      0 /250
      0/4
      Contact Information
      Submit

      CAD/CHF at 0.5855: Will the Swiss Franc Regain Control?

      Forex
      Summary:

      On 14 October 2026, CAD/CHF is quoted around 0.5857, with a reported intraday range of 0.5854–0.5858 in the latest available market snapshot. Your proposed SELL at 0.5855 is therefore close to the current trading area and needs careful entry confirmation....

      Sell CADCHF
      End Time
      CLOSED

      0.58550

      ENTRY

      0.58250

      TGT

      0.58750

      SL

      0.58581 -0.00038 -0.06%

      200

      Points

      Loss

      0.58250

      TGT

      0.58797

      CLOSING

      0.58550

      ENTRY

      0.58750

      SL
      Market Overview

      CAD/CHF reflects the balance between Canada's commodity-linked currency and Switzerland's defensive currency. The Canadian dollar has faced pressure following disappointing employment data released on 9 October. Reuters reported that Canada's currency fell to an 18-month low against the US dollar after employment figures weakened expectations of further Bank of Canada tightening. This is relevant to CAD/CHF because reduced expectations for Canadian interest rates can undermine the Canadian dollar's yield appeal, although movements in USD/CAD do not translate directly into an identical move against CHF.
      Oil prices are another important variable. Canada benefits from energy exports, so a sustained oil-price recovery could support CAD and limit the downside in CAD/CHF. Conversely, weaker oil prices could reinforce selling pressure. On the Swiss side, defensive demand may support CHF when investors become cautious about global growth or financial-market volatility. Nevertheless, Switzerland's monetary policy and the broader risk environment remain important; safe-haven flows alone do not guarantee CHF appreciation.
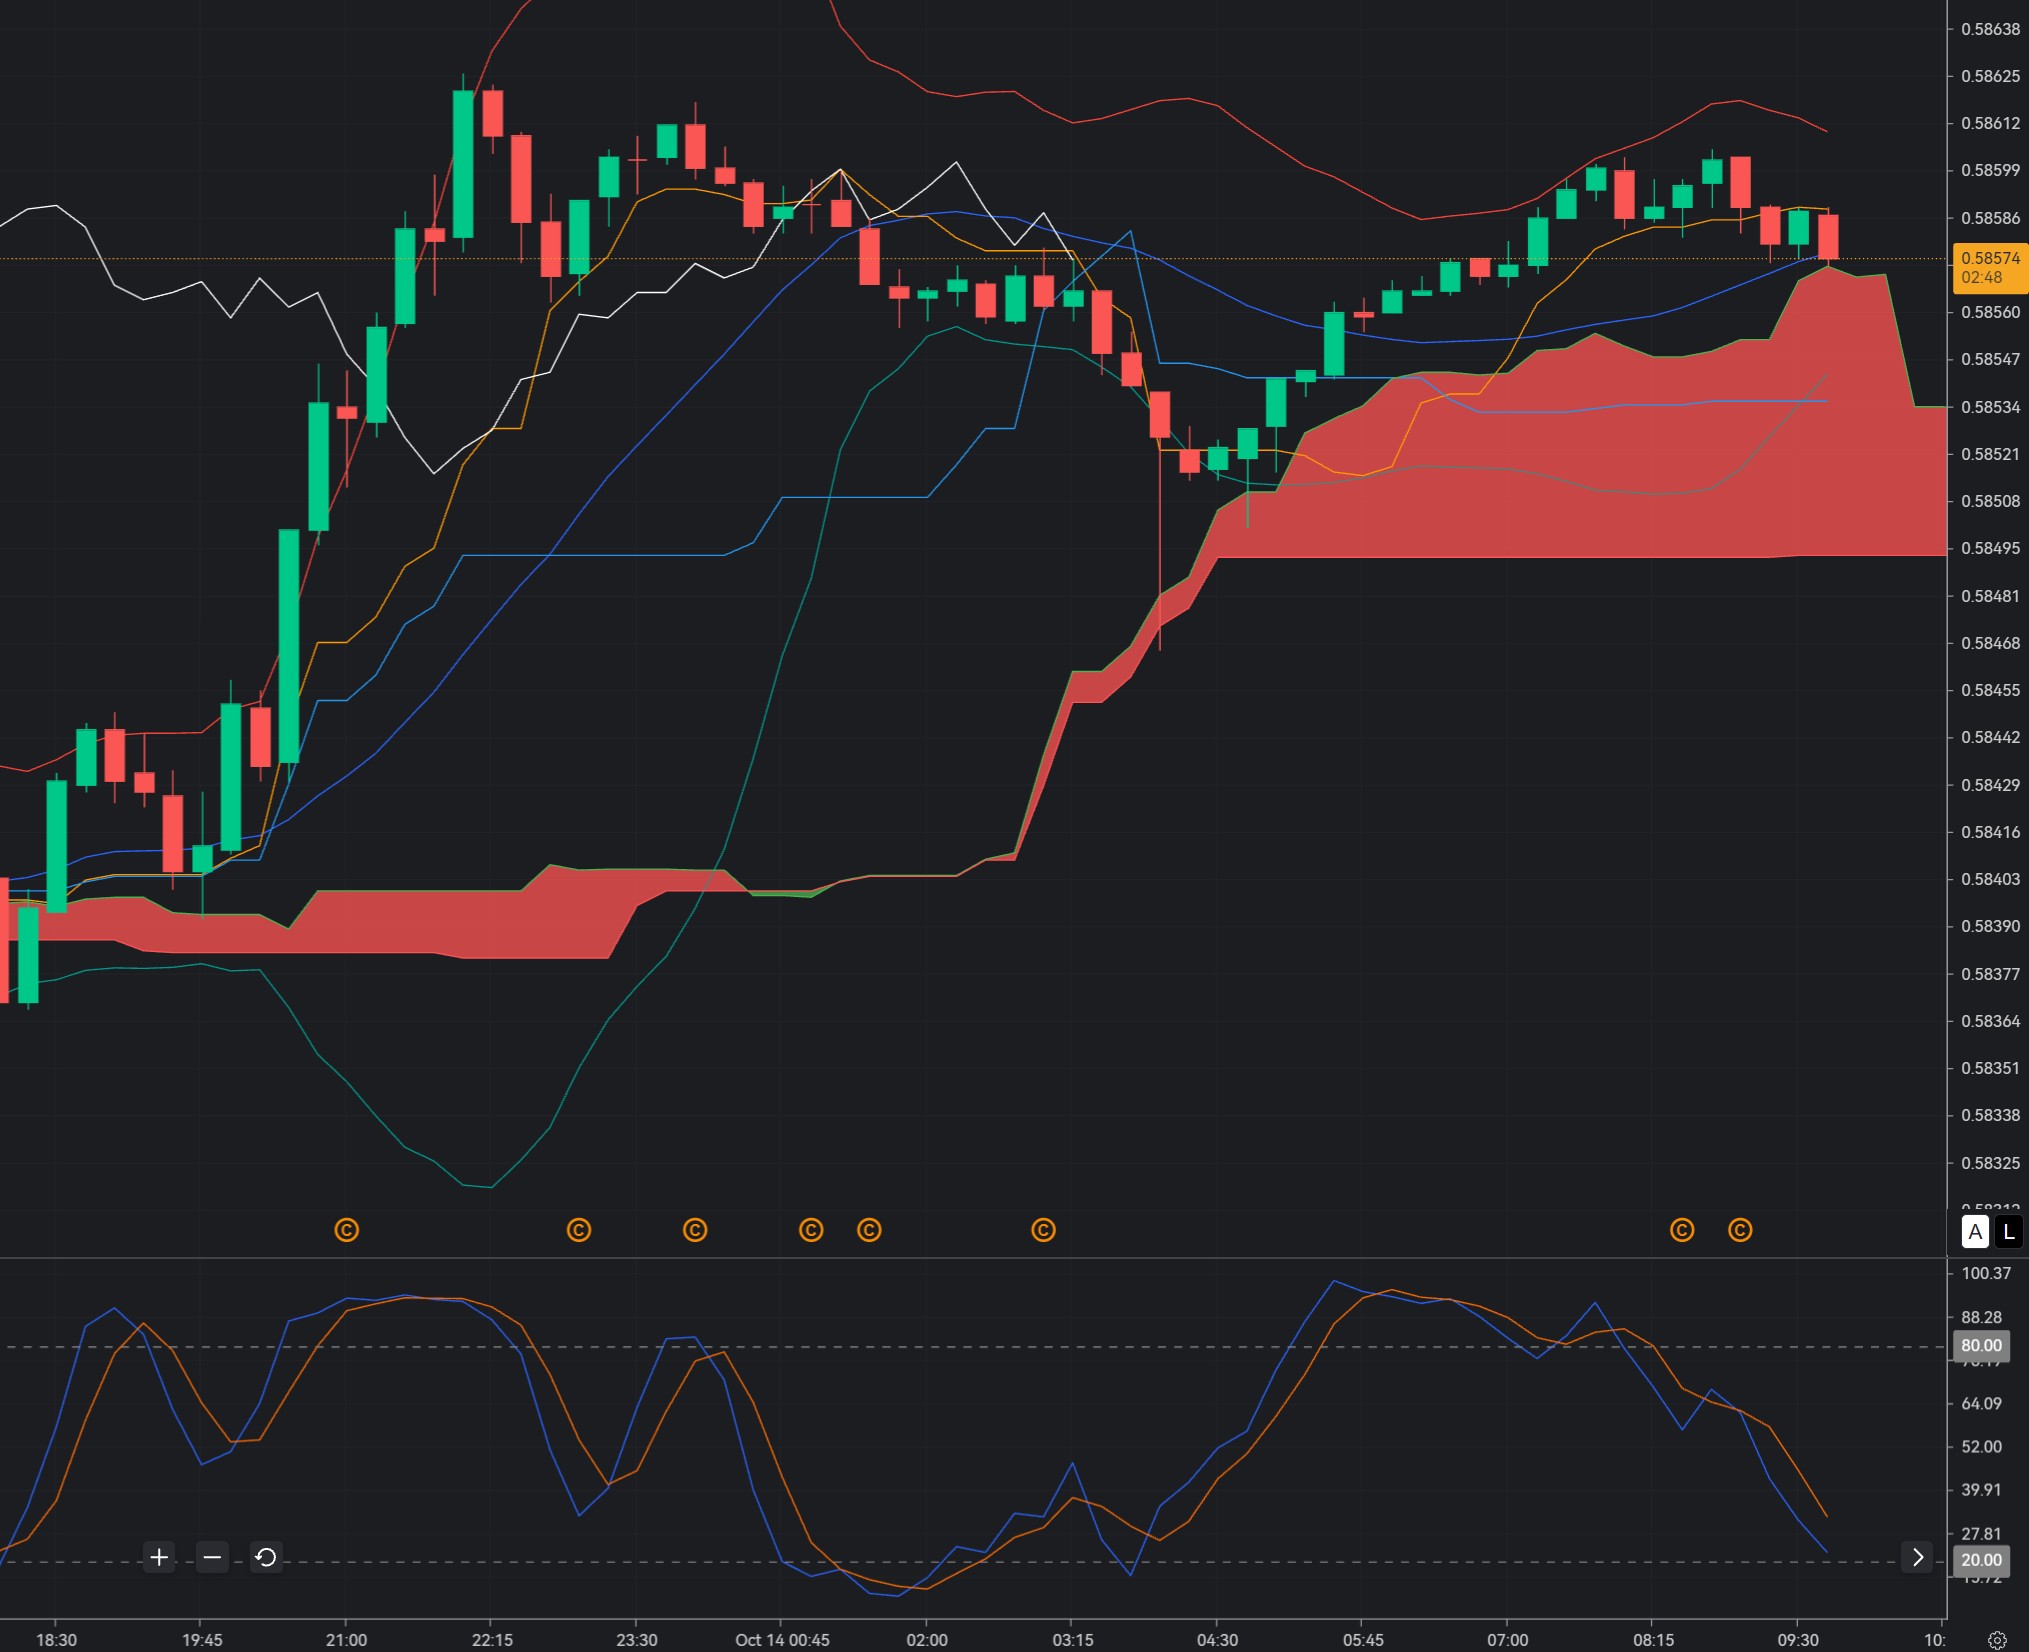
      The immediate technical context favours caution toward CAD. The latest available quote of 0.5857 sits near the proposed selling price of 0.5855, while the reported 52-week range of 0.5600–0.5910 places the pair relatively close to its upper boundary.
      This does not automatically mean a reversal is imminent, but it makes confirmation of resistance rejection more important than entering solely because the price appears elevated.

      Market Sentiment

      The latest detailed technical assessment available, dated 12 October, classified CAD/CHF as a SELL overall, with 12 sell signals, four neutral signals and six buy signals. Eight moving-average signals were bearish, while the oscillators were mixed. RSI(14) stood at 42.75 and MACD remained negative, suggesting downside pressure without an unequivocally oversold market.
      This distinction matters for the M15 setup. Bearish moving averages can support continuation, but mixed oscillators leave room for temporary recoveries. If price rises toward 0.5855–0.5858 and fails to break through, sellers may regain control. If it instead holds above 0.5858 and builds higher lows, the market may be absorbing selling pressure rather than preparing for another decline.
      The broader currency backdrop is also mixed. The US dollar weakened on 14 October as traders awaited US inflation data, reflecting uncertainty about future Federal Reserve decisions. This may affect overall currency-market volatility, but it is not direct evidence that CAD/CHF must decline.
      The strongest short-term confirmation should therefore come from CAD/CHF price action itself.

      Technical Analysis

      CAD/CHF at 0.5855: Will the Swiss Franc Regain Control?_1
      Bollinger Bands (20,0,2): Current live M15 band values could not be independently verified. For the SELL setup, look for price to reject the middle band or upper band near resistance, followed by a close toward the lower band. A widening envelope with successive bearish closes would support continuation. A strong close above the upper band, especially if followed by a successful retest, would weaken the bearish thesis.
      Ichimoku Kinko Hyo (9,26,52): The latest M15 Tenkan-sen, Kijun-sen and Kumo values are unavailable. The preferred bearish structure is price below the cloud, with Tenkan-sen below Kijun-sen and the cloud acting as overhead resistance. If price reclaims the cloud and holds above the Kijun-sen, the probability of a sustained immediate decline becomes less convincing.
      Stochastic (5,3,3): Wait for a bearish crossover after price tests the 0.5855–0.5858 area. A rollover from the upper region would suggest that buying momentum is fading. If Stochastic is already deeply oversold when price reaches support, avoid chasing the decline and wait for a rebound or a confirmed breakdown instead.
      The reported 12 October pivot analysis placed resistance around 0.5854 and support near 0.5815, with further support around 0.5806. These are older reference levels, not verified current M15 levels, so they should be treated as potential downside zones rather than guaranteed targets.
      The SELL scenario is strongest if 0.5855–0.5858 rejects price and 0.5854 subsequently breaks. Sustained movement above 0.5860 would weaken the immediate setup.

      Trade Recommendation

      Entry: 0.5855
      Take Profit: 0.5825
      Stop Loss: 0.5875
      Risk Warnings and Investment Disclaimers
      You understand and acknowledge that there is a high degree of risk involved in trading with strategies. Following any strategies or investment methodologies is the potential for loss. The content on the site is being provided by our contributors and analysts for information purposes only. You alone are solely responsible for determining whether any trading assets, or securities, or strategy, or any other product is suitable for you based on your investment objectives and financial situation.

      Quick Access to 7x24

      Quick Access to More Editor-selected Real-time News

      Exclusive video for free

      FastBull project team is dedicated to create exclusive videos

      Real-time Quotes

      View more faster market quotes

      More comprehensive macro data and economic indicators

      Members have access to entire historical data, guests can only view the last 4 years

      Member-only Database

      Comprehensive forex, commodity, and equity market data

      Gerik

      Analysts

      Primarily focused on selectively reposting top global financial articles, helping readers gain deep insights into the latest market trends, investment strategies, and economic dynamics. By curating high-quality content, it provides readers with comprehensive financial information, ensuring they stay up to date with industry developments.

      Rank

      5

      Articless

      1168

      Win Rate

      47.11%

      P/L Ratio

      1.24

      Focus on

      XAUUSD, BTC-USDT

      Related Analysis

      CAD/CHF at 0.5855: Will the Swiss Franc Regain Control?

      LOSS -200 Points

      EUR/USD at 1.1210: Will Dollar Strength Trigger Another Euro Sell-Off?

      PROFIT +350 Points

      EUR/USD at 1.1210: Will Dollar Strength Trigger Another Euro Sell-Off?

      PROFIT +350 Points

      Gold at $4,165: Can XAU/USD Recover as Traders Await US Inflation Data?

      LOSS -1713 Points

      Gold at $4,165: Can XAU/USD Recover as Traders Await US Inflation Data?

      LOSS -1724 Points
      FastBull
      English
      English
      العربية
      繁體中文
      简体中文
      Bahasa Melayu
      Bahasa Indonesia
      ภาษาไทย
      Tiếng Việt
      Economic Calendar 7x24 Quotes Video Analysis Data Warehouse Pro AI Signal News