XAUUSD
4322.16

1.36%

WTI
96.076

1.44%

EURUSD
1.14790

0.15%

GBPUSD
1.34049

0.20%

USDJPY
155.567

0.47%

USNDAQ100
29292.57

1.09%

Global Markets

Economic Calendar
7x24
Quotes

Video

Latest Update

Risk Warning on Trading HK Stocks

Despite Hong Kong's robust legal and regulatory framework, its stock market still faces unique risks and challenges, such as currency fluctuations due to the Hong Kong dollar's peg to the US dollar and the impact of mainland China's policy changes and economic conditions on Hong Kong stocks.

HK Stock Trading Fees and Taxation

Trading costs in the Hong Kong stock market include transaction fees, stamp duty, settlement charges, and currency conversion fees for foreign investors. Additionally, taxes may apply based on local regulations.

HK Non-Essential Consumer Goods Industry

The Hong Kong stock market encompasses non-essential consumption sectors like automotive, education, tourism, catering, and apparel. Of the 643 listed companies, 35% are mainland Chinese, making up 65% of the total market capitalization. Thus, it's heavily influenced by the Chinese economy.

HK Real Estate Industry

In recent years, the real estate and construction sector's share in the Hong Kong stock index has notably decreased. Nevertheless, as of 2022, it retains around 10% market share, covering real estate development, construction engineering, investment, and property management.

Analysis
Data

Data Warehouse Market Trend Institutional Data Policy Rates Macro

Market Trend

Speculative Sentiment Orders and Positions Correlation

Popular Indicators

Pro
AI Signal

Trading Signals

AI Signal

News
Recent Searches
    Trending Searches
      News
      7x24
      Quotes
      Economic Calendar
      Video
      Data
      • Names
      • Latest
      • Prev.

      View All

      No data

      Sign in

      Sign up

      --

      • My Favorites
      • My Subscription
      • Profile
      • Orders
      • Account Settings
      • Sign out
      Reminder Settings
      • Economic Calendar
      • Quotes/Market Quotes

      Reminders Temporarily Unavailable

      FastBull Membership Privileges
      Quick Access to 7x24
      Quick Access to More Editor-selected Real-time News
      Real-time Quotes
      View more faster market quotes
      Upgrade to {0} Pro
      I have read and agreed to the
      Pro Policy
      Feedback
      0 /250
      0/4
      Contact Information
      Submit

      Gold $4,330 Retest: Can the Fed-Driven Selloff Continue?

      Commodity
      Summary:

      Gold enters 17 September under renewed selling pressure after the Fed raised rates by 25 bps to 3.75%–4.00% and signalled that another increase could still be required, pushing XAU/USD toward $4,265 in early Asian trading. ...

      Sell XAUUSD
      EXP
      Trading

      4330.00

      ENTRY

      4270.00

      TGT

      4360.00

      SL

      4322.16 +57.91 +1.36%

      0

      Point

      Flat

      4270.00

      TGT

      CLOSING

      4330.00

      ENTRY

      4360.00

      SL
      Overview

      The fundamental backdrop has shifted further against gold following Wednesday's Federal Reserve decision. The Fed delivered the expected 25-bp hike, taking the target range to 3.75%–4.00%, while Chair Kevin Warsh maintained a firm stance on inflation and indicated that another increase could be necessary. The reaction was immediate: gold fell toward $4,265 as the dollar strengthened and higher rates increased the opportunity cost of holding non-yielding bullion.
      This is important for the 4,330 SELL because the level now represents a potential retest of broken short-term structure. Before the Fed decision, $4,330 was already identified as the 100-day SMA area and a meaningful upside cap, while $4,280 represented the key 50-day SMA support. After the subsequent break below $4,280, a rebound toward $4,330 would allow sellers to test whether former support has converted into resistance.
      The macro environment also remains challenging. U.S. Treasury yields remain elevated around the 5% area, while higher oil prices are keeping inflation concerns alive. This combination supports a stronger dollar and reduces the attractiveness of gold despite continued geopolitical safe-haven demand.

      Market Sentiment

      Market sentiment has become increasingly defensive toward gold. The metal has now recorded three consecutive losing sessions, with StoneX reporting a decline of almost 2.3% and describing the short-term bias as increasingly bearish. The significant point is that gold failed to sustain the recovery toward $4,330 despite having previously shown resilience around the $4,280 support.
      However, the decline itself creates a timing problem for sellers. XAU/USD has already fallen sharply, so selling at $4,265–$4,280 would mean entering close to support. A rebound into $4,330 offers substantially better positioning because it places the trade against a documented resistance area while keeping the invalidation relatively tight.
      The main risk is a dovish repricing after the initial Fed reaction. If investors interpret the hike as an isolated insurance move rather than the beginning of a prolonged tightening cycle, Treasury yields and the dollar could retreat, allowing gold to reclaim $4,330. Geopolitical risk also remains a source of safe-haven demand, meaning the bearish setup is strongest only while price remains below the resistance structure.

      Technical Analysis

      Gold $4,330 Retest: Can the Fed-Driven Selloff Continue?_1
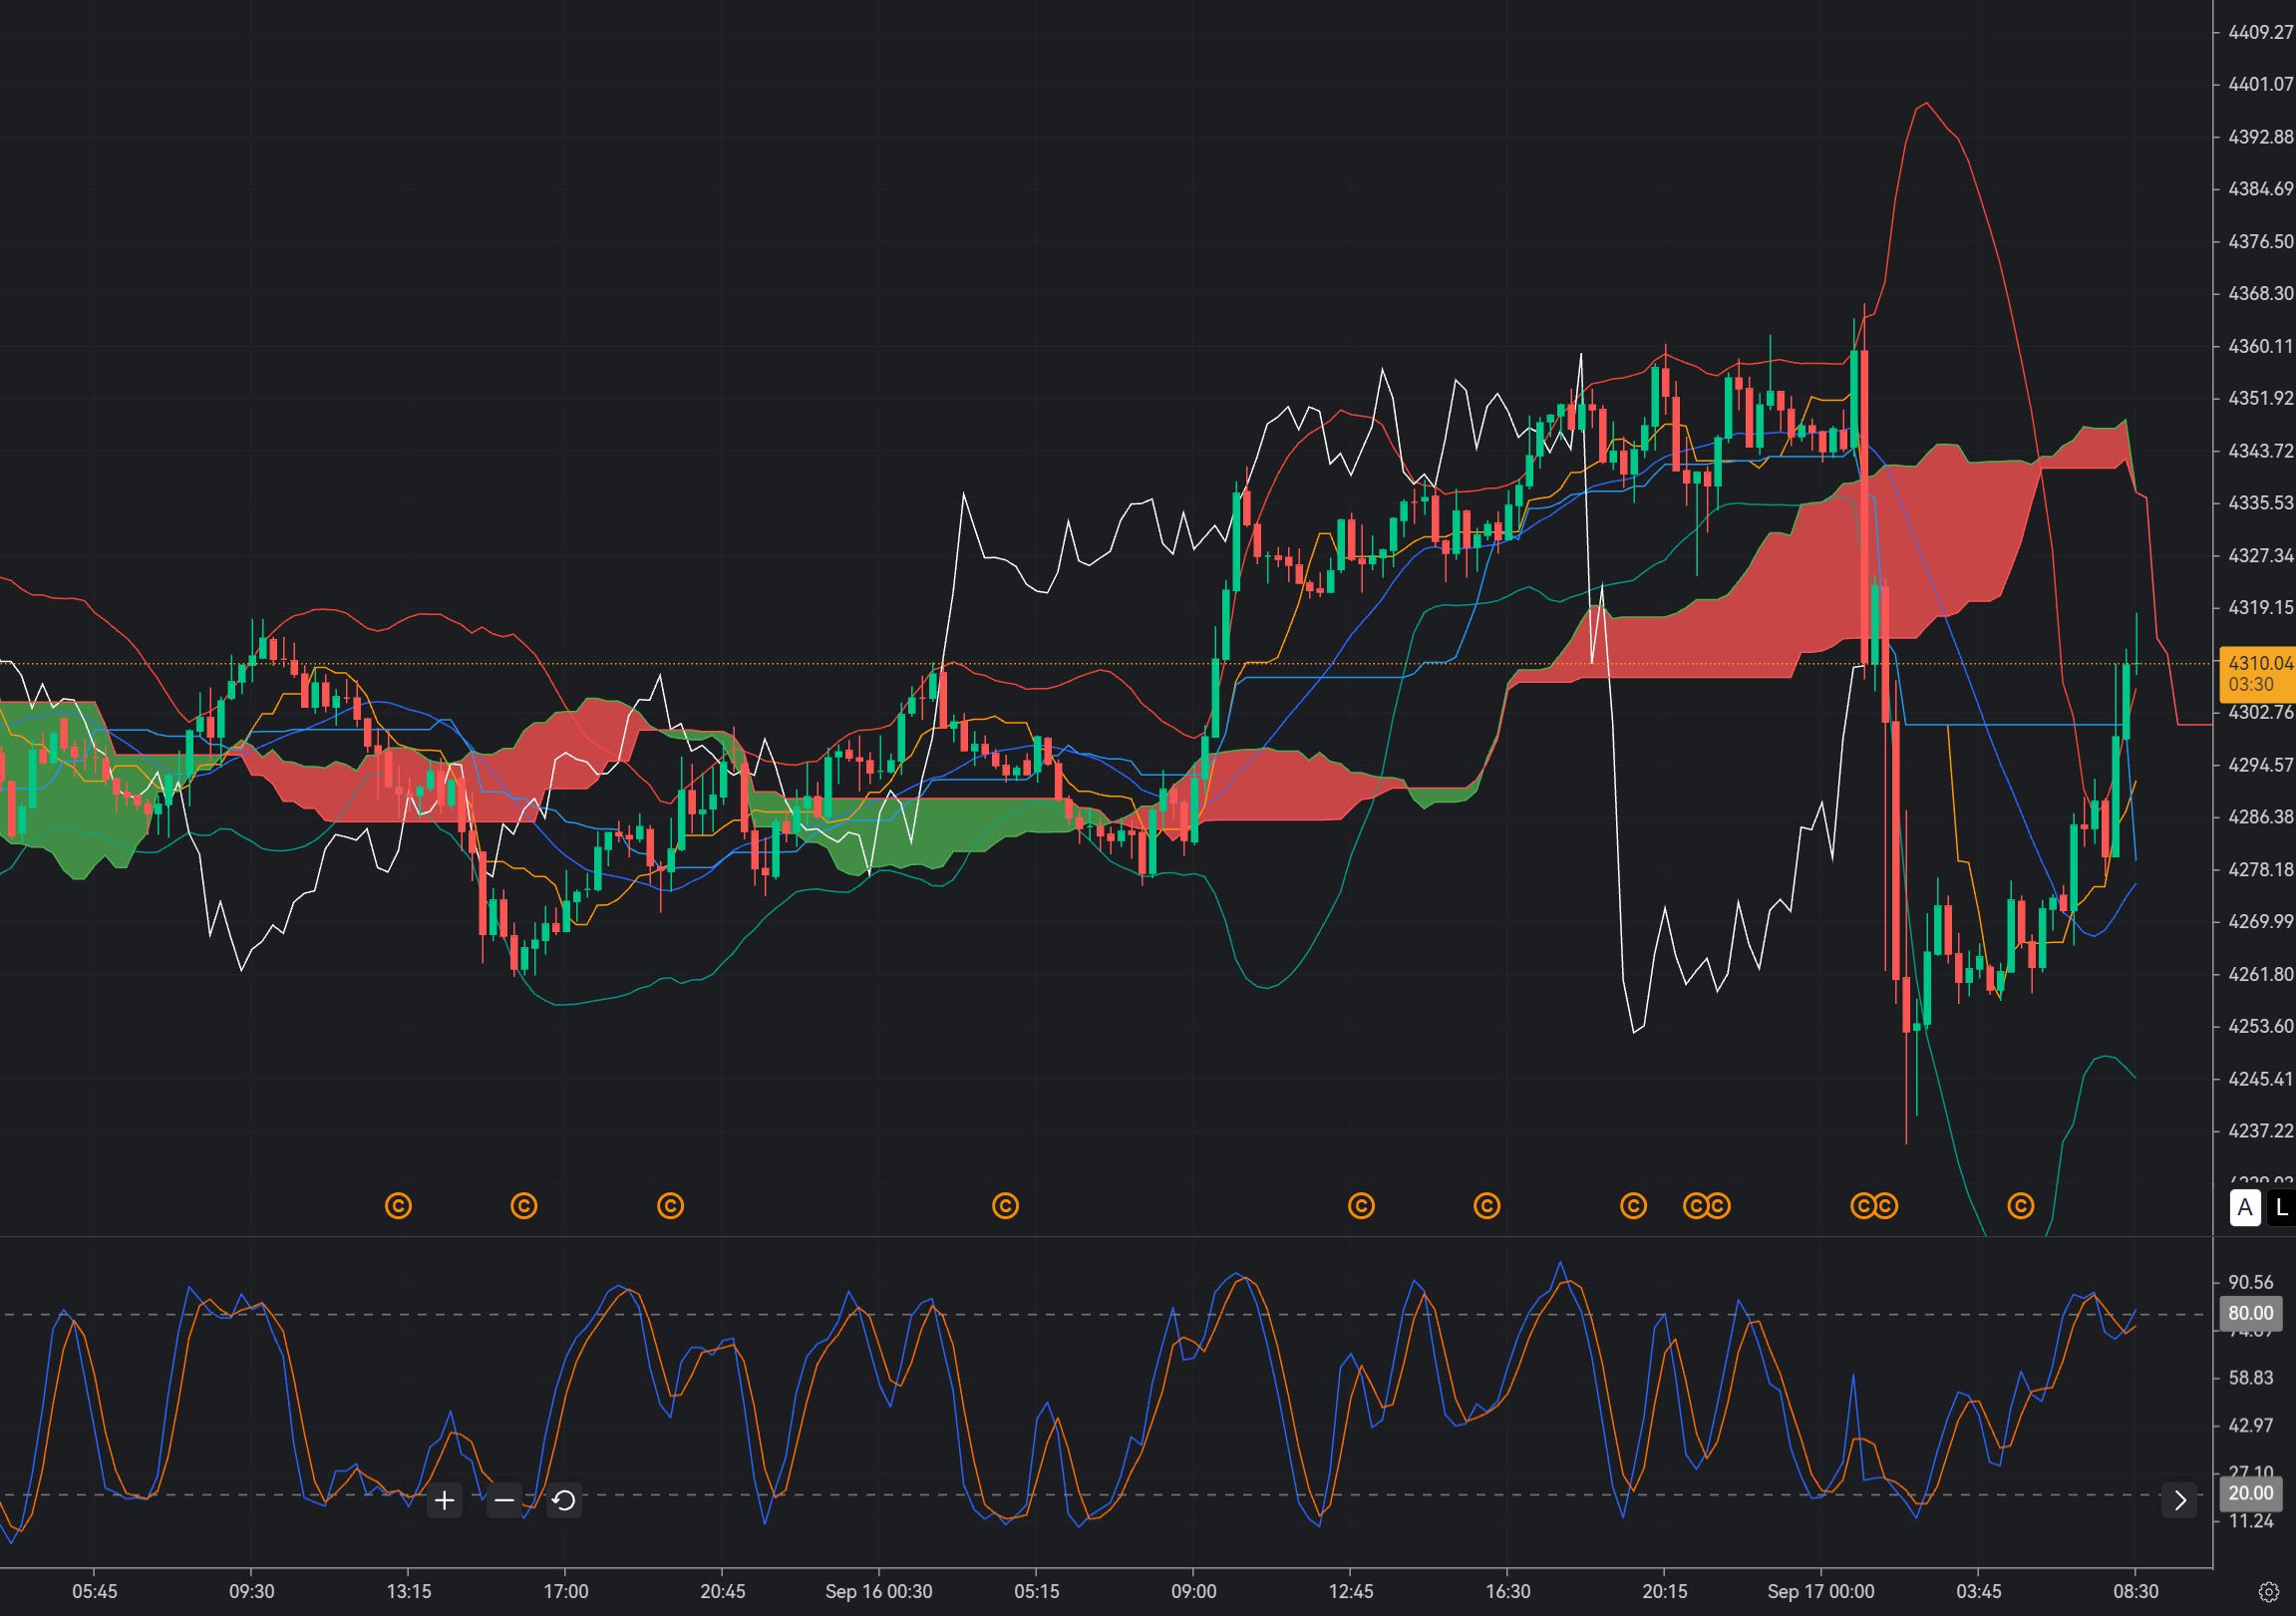
      On M15, $4,330 is the key decision level. StoneX identifies $4,330 as the near-term barrier and equilibrium zone, while $4,170 is the next major structural support. The latest decline toward $4,265 means the preferred SELL is a retracement into $4,330 followed by an M15 rejection, rather than selling after the initial bearish impulse.
      With Bollinger Bands (20,0,2), the recent selloff has pushed price toward the lower band, increasing the probability of a corrective rebound. A move back toward $4,330 would bring price closer to the middle/upper portion of the M15 structure. If the upper band begins turning downward while price fails around $4,330, this would support another bearish expansion.
      For Ichimoku (9,26,52), the preferred configuration is price remaining below the Kijun-sen and cloud. The strongest confirmation would be an M15 recovery toward $4,330 that enters the cloud or tests the Kijun and then closes back below it. That would indicate that the rebound is corrective rather than a structural reversal.
      The Stochastic (5,3,3) should ideally recover from oversold conditions before turning downward again near $4,330. This is important because selling while Stochastic remains deeply oversold would mean entering after an already extended move. A bearish crossover around the entry would provide better momentum confirmation.
      The first downside objective is $4,270, followed by $4,220. If $4,220 fails, the larger structural target becomes the $4,170 region identified by current technical analysis. Conversely, an M15 close and sustained acceptance above $4,355 would weaken the SELL setup because it would indicate that buyers have reclaimed the resistance area rather than merely producing a corrective bounce.

      Trade Recommendation

      Entry: 4330
      Take Profit: 4270
      Stop Loss: 4360
      Risk Warnings and Investment Disclaimers
      You understand and acknowledge that there is a high degree of risk involved in trading with strategies. Following any strategies or investment methodologies is the potential for loss. The content on the site is being provided by our contributors and analysts for information purposes only. You alone are solely responsible for determining whether any trading assets, or securities, or strategy, or any other product is suitable for you based on your investment objectives and financial situation.

      Quick Access to 7x24

      Quick Access to More Editor-selected Real-time News

      Exclusive video for free

      FastBull project team is dedicated to create exclusive videos

      Real-time Quotes

      View more faster market quotes

      More comprehensive macro data and economic indicators

      Members have access to entire historical data, guests can only view the last 4 years

      Member-only Database

      Comprehensive forex, commodity, and equity market data

      Gerik

      Analysts

      Primarily focused on selectively reposting top global financial articles, helping readers gain deep insights into the latest market trends, investment strategies, and economic dynamics. By curating high-quality content, it provides readers with comprehensive financial information, ensuring they stay up to date with industry developments.

      Rank

      7

      Articless

      1092

      Win Rate

      46.95%

      P/L Ratio

      1.23

      Focus on

      BTC-USDT, XAUUSD

      Related Analysis

      AUD/JPY 110.67: Can the BOJ Trigger a Fresh Yen-Led Breakdown?

      Trading

      AUD/JPY 110.67: Can the BOJ Trigger a Fresh Yen-Led Breakdown?

      Trading

      EUR/CAD 1.6030: Can Buyers Defend the Lower Range and Trigger an M15 Recovery?

      PENDING

      EUR/CAD 1.6030: Can Buyers Defend the Lower Range and Trigger an M15 Recovery?

      PENDING

      Gold $4,330 Retest: Can the Fed-Driven Selloff Continue?

      Trading
      FastBull
      English
      English
      العربية
      繁體中文
      简体中文
      Bahasa Melayu
      Bahasa Indonesia
      ภาษาไทย
      Tiếng Việt
      Economic Calendar 7x24 Quotes Video Analysis Data Warehouse Pro AI Signal News