XAUUSD
3960.59

0.35%

WTI
93.707

1.70%

EURUSD
1.11925

0.06%

GBPUSD
1.34236

0.14%

USDJPY
158.061

0.08%

USNDAQ100
28275.12

0.57%

Global Markets

Economic Calendar
7x24
Quotes

Video

Latest Update

Risk Warning on Trading HK Stocks

Despite Hong Kong's robust legal and regulatory framework, its stock market still faces unique risks and challenges, such as currency fluctuations due to the Hong Kong dollar's peg to the US dollar and the impact of mainland China's policy changes and economic conditions on Hong Kong stocks.

HK Stock Trading Fees and Taxation

Trading costs in the Hong Kong stock market include transaction fees, stamp duty, settlement charges, and currency conversion fees for foreign investors. Additionally, taxes may apply based on local regulations.

HK Non-Essential Consumer Goods Industry

The Hong Kong stock market encompasses non-essential consumption sectors like automotive, education, tourism, catering, and apparel. Of the 643 listed companies, 35% are mainland Chinese, making up 65% of the total market capitalization. Thus, it's heavily influenced by the Chinese economy.

HK Real Estate Industry

In recent years, the real estate and construction sector's share in the Hong Kong stock index has notably decreased. Nevertheless, as of 2022, it retains around 10% market share, covering real estate development, construction engineering, investment, and property management.

Analysis
Data

Data Warehouse Market Trend Institutional Data Policy Rates Macro

Market Trend

Speculative Sentiment Orders and Positions Correlation

Popular Indicators

Pro
AI Signal

Trading Signals

AI Signal

News
Recent Searches
    Trending Searches
      News
      7x24
      Quotes
      Economic Calendar
      Video
      Data
      • Names
      • Latest
      • Prev.

      View All

      No data

      Sign in

      Sign up

      --

      • My Favorites
      • My Subscription
      • Profile
      • Orders
      • Account Settings
      • Sign out
      Reminder Settings
      • Economic Calendar
      • Quotes/Market Quotes

      Reminders Temporarily Unavailable

      FastBull Membership Privileges
      Quick Access to 7x24
      Quick Access to More Editor-selected Real-time News
      Real-time Quotes
      View more faster market quotes
      Upgrade to {0} Pro
      I have read and agreed to the
      Pro Policy
      Feedback
      0 /250
      0/4
      Contact Information
      Submit

      Gold's latest rebound follows a severe sell-off that pushed prices to a one-year low on Friday

      Commodity
      Summary:

      Reuters reported that spot gold rose more than 2% on Monday, reaching $3,957.19 per ounce, after oil prices fell by more than 6% amid renewed hopes for diplomatic progress in the Middle East...

      Sell XAUUSD
      End Time
      CLOSED

      3940.00

      ENTRY

      3900.00

      TGT

      3960.00

      SL

      3960.90 +14.13 +0.36%

      2000

      Points

      Loss

      3900.00

      TGT

      3960.23

      CLOSING

      3940.00

      ENTRY

      3960.00

      SL
      Market Overview

      Gold's latest rebound follows a severe sell-off that pushed prices to a one-year low on Friday. Reuters reported that spot gold rose more than 2% on Monday, reaching $3,957.19 per ounce, after oil prices fell by more than 6% amid renewed hopes for diplomatic progress in the Middle East. Lower oil prices eased immediate inflation concerns, supporting bullion, but the recovery has not yet reversed the broader bearish trend. 
      Your SELL entry at $3,940 is particularly important because it sits near a former support region that may now act as resistance. StoneX identifies $3,942–$4,000 as a key resistance zone following gold's breakdown below $4,000. If price rallies into this area and fails to break through, sellers could regain control. However, a sustained recovery above $3,942 would make an immediate short position more vulnerable to a squeeze toward $4,000. 
      The macroeconomic backdrop remains mixed. Expectations of another Federal Reserve rate increase in December continue to weigh on gold because higher yields increase the opportunity cost of holding a non-yielding asset. At the same time, easing geopolitical tensions can reduce safe-haven demand, although renewed escalation could quickly reverse that effect. The critical issue is whether selling pressure returns as gold approaches resistance or whether buyers can extend the recovery.
      For this trade, $3,940 should be treated as a potential rejection area rather than an automatically valid SELL signal. A bearish M15 reversal around this level would support the setup; a sustained breakout above resistance would weaken it.

      Market Sentiment

      Gold sentiment remains bearish overall, but the latest rebound creates a meaningful risk for traders entering short positions too aggressively. On Monday, gold recovered after Friday's sharp liquidation, when technology-sector weakness triggered margin calls and forced investors to sell assets they would normally hold for protection. This suggests that the recent decline was driven not only by changing monetary expectations but also by liquidity pressures. 
      The bearish argument remains that expectations of tighter US monetary policy could keep Treasury yields elevated and limit gold's recovery. Nevertheless, the market has already experienced substantial selling, so further downside may require a fresh catalyst. Selling at $3,940 is more attractive if the price rallies into resistance and buyers fail to maintain momentum, rather than selling after another extended decline.
      The main invalidation risk is a sustained move above $3,942, followed by a recovery toward $4,000. Such price action would indicate that buyers are absorbing supply around the former support zone. Conversely, a rejection at $3,940 and a return below $3,920 would strengthen the bearish case.

      Technical Analysis

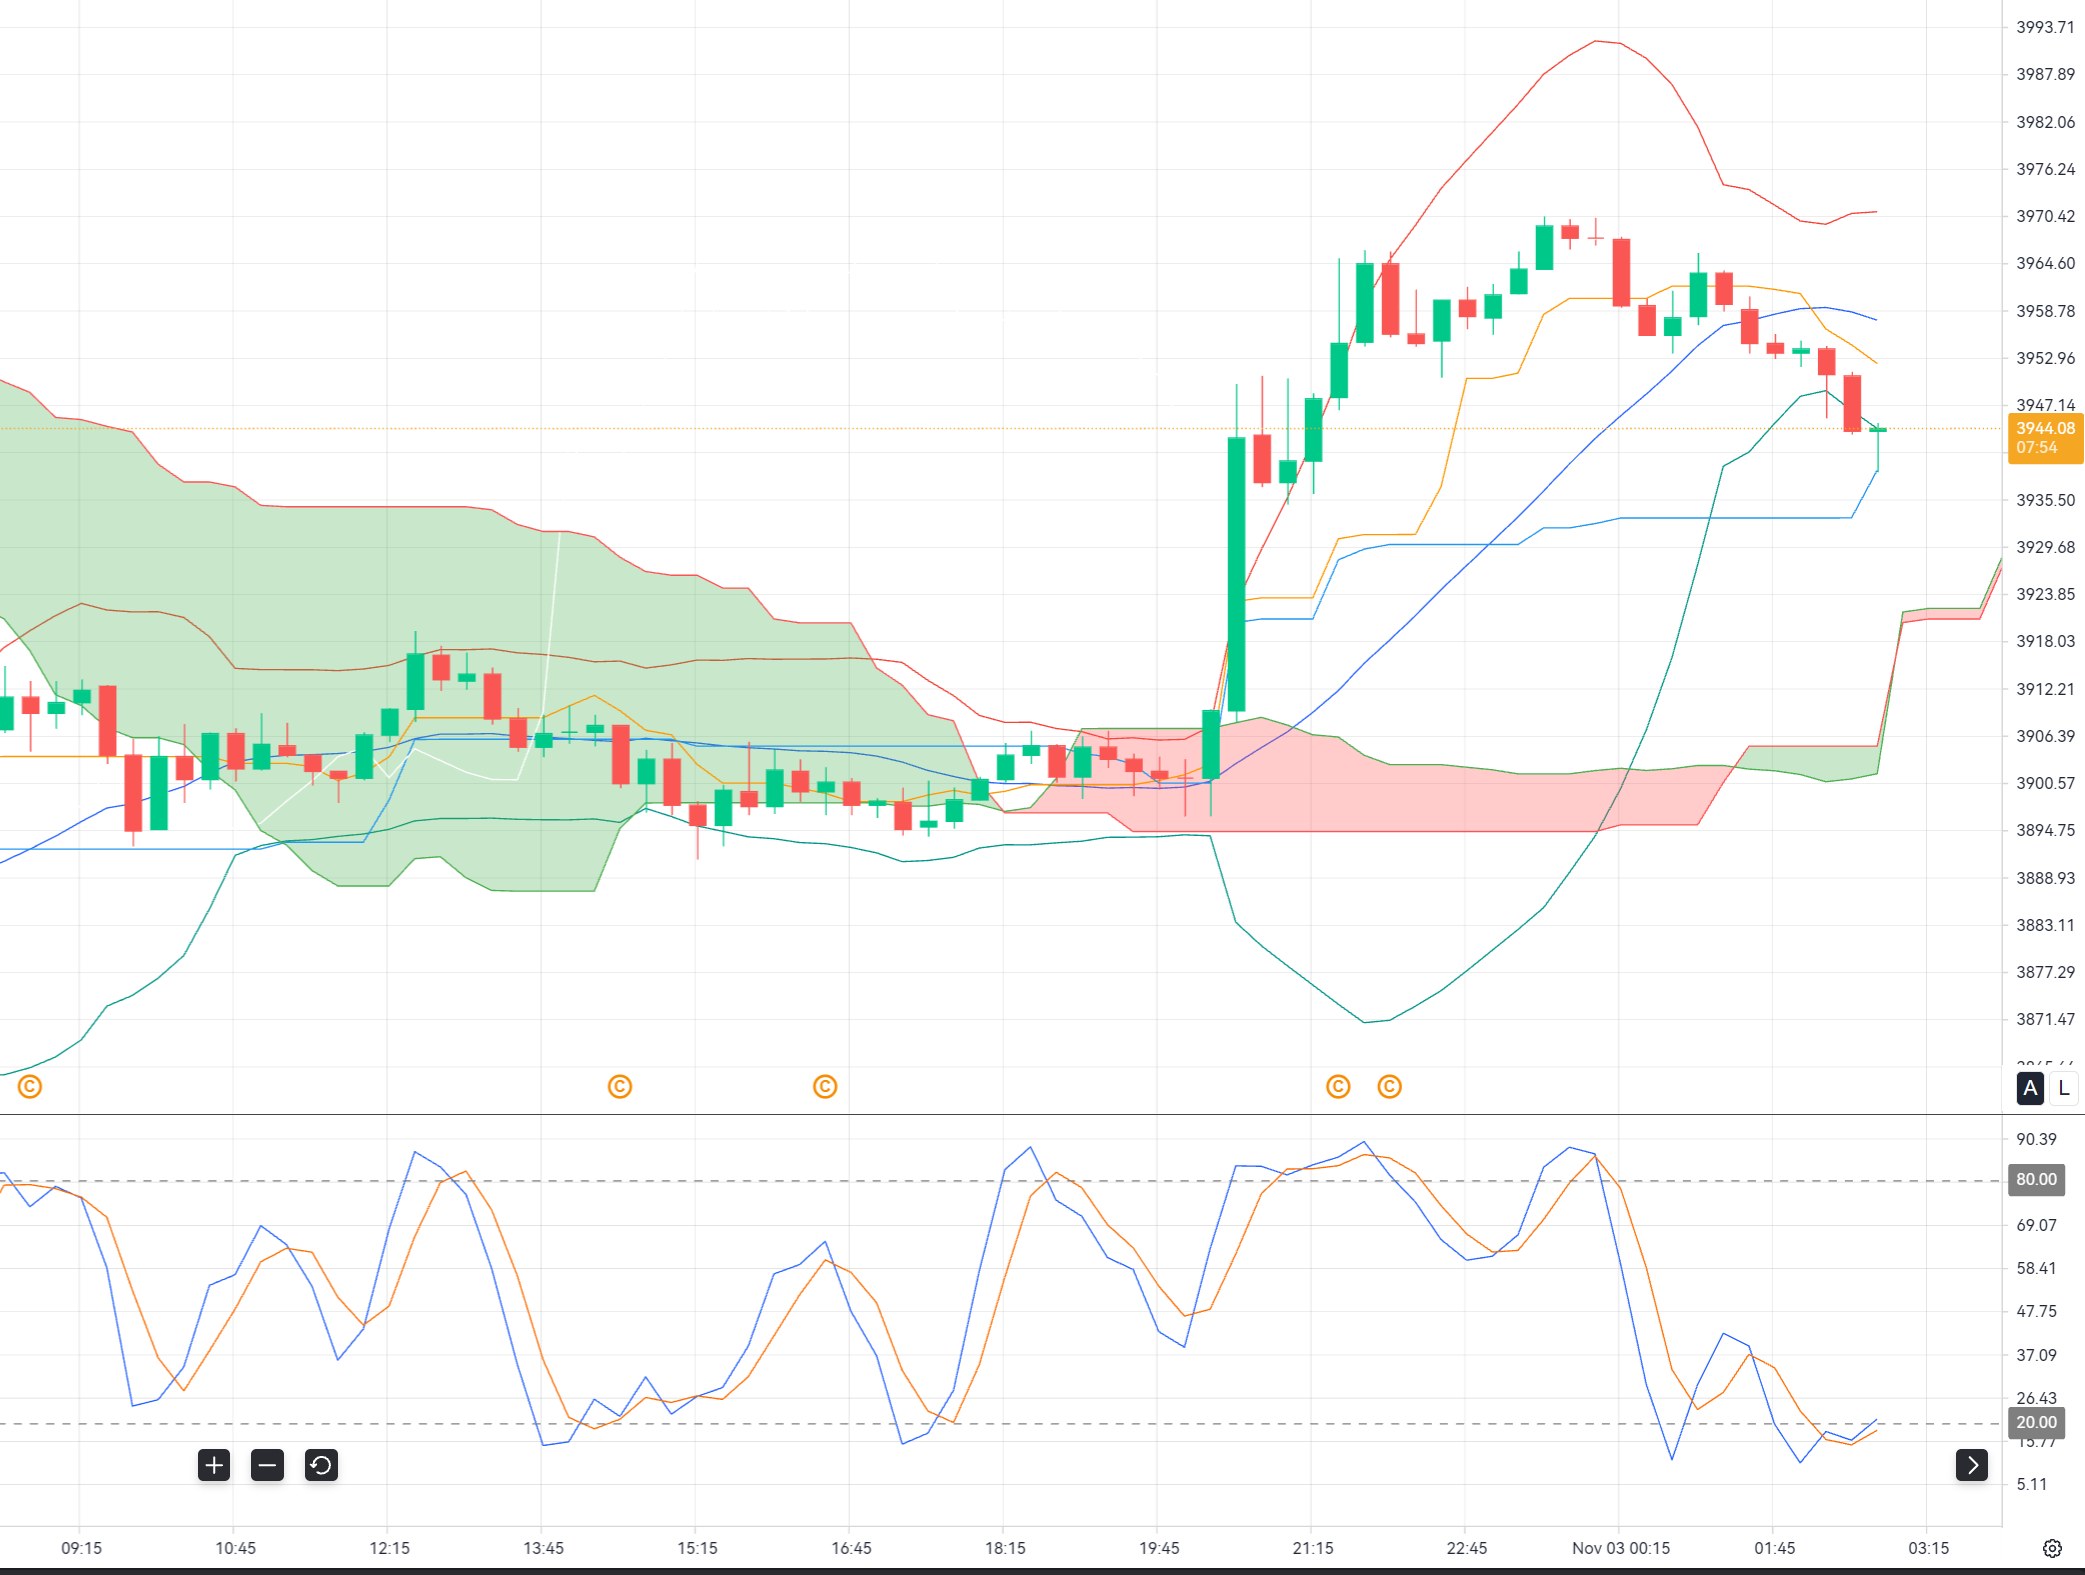
      Gold's latest rebound follows a severe sell-off that pushed prices to a one-year low on Friday_1
      Bollinger Bands (20,0,2): Look for price to approach the upper band near the $3,940 entry and then close back inside the bands. This would suggest that the recovery is losing momentum. If the bands expand upward and price continues closing near the upper band, avoid assuming that the rebound has ended.
      Ichimoku Kinko Hyo (9,26,52): A bearish Tenkan-sen/Kijun-sen crossover, with price remaining below the cloud, would support the SELL. If price breaks above the Kijun-sen and moves into the cloud, bearish momentum is weakening. A sustained move above the cloud would undermine the short-term setup.
      Stochastic (5,3,3): A bearish crossover above 80 near $3,940 would strengthen the entry, particularly if accompanied by a lower high. However, an overbought reading alone is insufficient because strong rebounds can sustain upward momentum. The preferred confirmation is a bearish crossover combined with a failed resistance breakout.
      The broader structure favours selling rallies, but gold's recovery from its recent low makes confirmation essential. The live M15 readings of these indicators have not been independently verified, so the setup remains conditional.

      Trade Recommendation

      Entry: 3940.00
      Take Profit: 3900.00
      Stop Loss: 3960.00
      Risk Warnings and Investment Disclaimers
      You understand and acknowledge that there is a high degree of risk involved in trading with strategies. Following any strategies or investment methodologies is the potential for loss. The content on the site is being provided by our contributors and analysts for information purposes only. You alone are solely responsible for determining whether any trading assets, or securities, or strategy, or any other product is suitable for you based on your investment objectives and financial situation.

      Quick Access to 7x24

      Quick Access to More Editor-selected Real-time News

      Exclusive video for free

      FastBull project team is dedicated to create exclusive videos

      Real-time Quotes

      View more faster market quotes

      More comprehensive macro data and economic indicators

      Members have access to entire historical data, guests can only view the last 4 years

      Member-only Database

      Comprehensive forex, commodity, and equity market data

      Gerik

      Analysts

      Primarily focused on selectively reposting top global financial articles, helping readers gain deep insights into the latest market trends, investment strategies, and economic dynamics. By curating high-quality content, it provides readers with comprehensive financial information, ensuring they stay up to date with industry developments.

      Rank

      4

      Articless

      1228

      Win Rate

      47.44%

      P/L Ratio

      1.24

      Focus on

      BTC-USDT, XAUUSD

      Related Analysis

      Gold's latest rebound follows a severe sell-off that pushed prices to a one-year low on Friday

      LOSS -2000 Points

      CAD/CHF BUY at 0.5850: Will Key Support Trigger a Bullish Reversal?

      Trading

      CAD/CHF BUY at 0.5850: Will Key Support Trigger a Bullish Reversal?

      Trading

      EUR/USD BUY at 1.1190: Can the Euro Extend Its Recovery Toward 1.1230?

      Trading

      EUR/USD BUY at 1.1190: Can the Euro Extend Its Recovery Toward 1.1230?

      Trading
      FastBull
      English
      English
      العربية
      繁體中文
      简体中文
      Bahasa Melayu
      Bahasa Indonesia
      ภาษาไทย
      Tiếng Việt
      Economic Calendar 7x24 Quotes Video Analysis Data Warehouse Pro AI Signal News