News
7x24
Quotes
Economic Calendar
Video
Data
- Names
- Latest
- Prev.
Latest Update

Risk Warning on Trading HK Stocks
Despite Hong Kong's robust legal and regulatory framework, its stock market still faces unique risks and challenges, such as currency fluctuations due to the Hong Kong dollar's peg to the US dollar and the impact of mainland China's policy changes and economic conditions on Hong Kong stocks.

HK Stock Trading Fees and Taxation
Trading costs in the Hong Kong stock market include transaction fees, stamp duty, settlement charges, and currency conversion fees for foreign investors. Additionally, taxes may apply based on local regulations.

HK Non-Essential Consumer Goods Industry
The Hong Kong stock market encompasses non-essential consumption sectors like automotive, education, tourism, catering, and apparel. Of the 643 listed companies, 35% are mainland Chinese, making up 65% of the total market capitalization. Thus, it's heavily influenced by the Chinese economy.

HK Real Estate Industry
In recent years, the real estate and construction sector's share in the Hong Kong stock index has notably decreased. Nevertheless, as of 2022, it retains around 10% market share, covering real estate development, construction engineering, investment, and property management.
Market Trend
Popular Indicators
AI Signal
View All

No data

Sign in
Sign up
--

Reminders Temporarily Unavailable


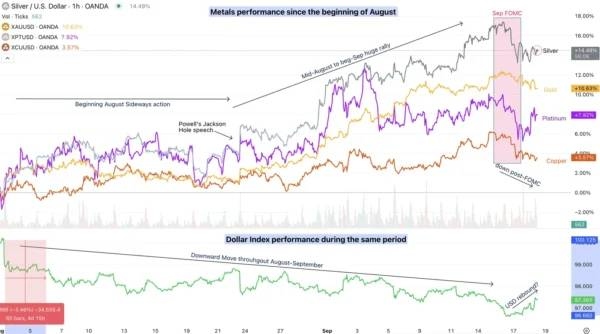
Gold and Silver are subject to immediate pressure as the US Dollar regains strength and reputation after yesterday’s FOMC meeting.
Gold and Silver are subject to immediate pressure as the US Dollar regains strength and reputation after yesterday’s FOMC meeting.The challenged independence of the Fed was a major driver behind the immense rally metals enjoyed from late August into early September, as Powell’s shift in tone from the Jackson Hole conference cast doubt on the Fed’s consistency amid still high inflation.
Yet the dovish stance advocated by Bowman and Waller, seen as President Trump’s protege-appointees ahead of the Sep FOMC—was vindicated by subsequent NFP misses and the downward revisions in BLS data.
This is leading to the Federal Reserve regaining back some of its lost confidence throughout the past few months.

Silver rallied 18.67% from its July 31st trough to its Tuesday peak, while Gold surged from $3,268 on July 30th to fresh all-time highs at $3,707.
Despite the ongoing pullback, prices remain near their highs.
Still, the balance is tilting towards a more neutral trend: With Powell delivering a less dovish message than markets had priced in, the renewed resilience of the US Dollar could set the stage for tighter price action ahead.Let’s dive into two timeframe charts for both Gold (XAU/USD) and Silver (XAG/USD) to see where the current trading takes us and where to look going forward.
Gold and Silver two-timeframe picture

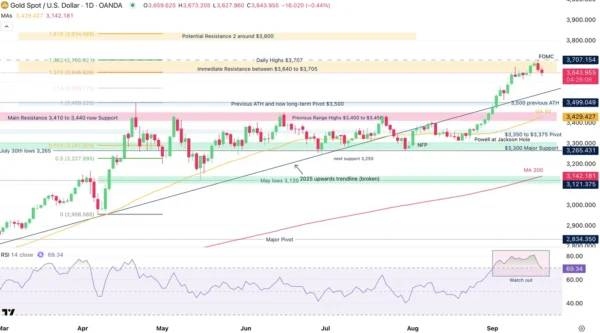
Gold responded remarkably to the technical-Fibonacci induced resistance mentioned in our most recent Gold analysis.We precedently expressed how overbought levels don’t imply tops, particularly amid strong performance and momentum.However, Daily RSI is starting to shape downwards and may not help to sustain the current levels.There is still an ongoing consolidation that is happening from the intermediate lows, which demands a closer look.

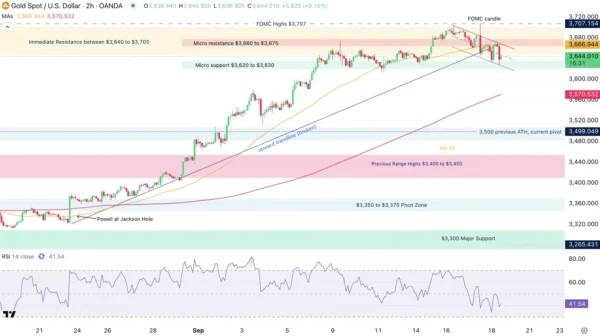
Selling momentum is currently stalling but the bigger timeframe outlook is showing signs of slowdown within the current trend, particularly when seeing the broken upward trendline that led to the new $3,707 All-time Highs.Look for breakouts either above or below the Micro support and resistance zones, with their levels detailed just below.
Levels of interest for Gold trading:
Support:
Resistance and potential technical targets (due to all-time highs, can only use potential targets):

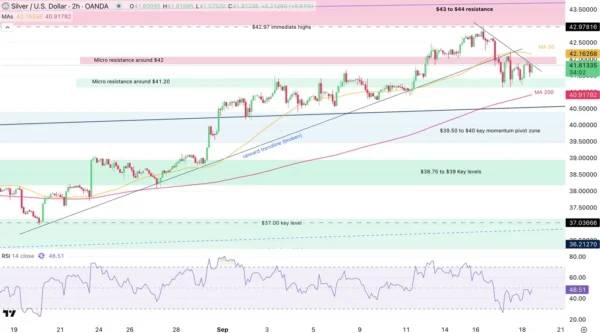
Since our most recent Silver Analysis, prices did effectively break out of its daily upward channel but found technical resistance (to complement the fundamental resistance) at the higher bound of the Higher timeframe channel (in Blue).Look at the Daily RSI also showing some type of divergence – Overall, despite the action still hanging at the highs, it looks like some intermediate correction might come into play.
Let’s have a closer look.

The selling from this yesterday to this morning’s session has stalled a bit and short-term momentum is back to neutral.Prices are now contained between an short-term resistance and support zone, in the ongoing $41.20 to $42 range.
Levels to watch for Silver (XAG) trading:
Resistance Levels:
Support Levels:

Quick Access to 7x24
Quick Access to More Editor-selected Real-time News

Exclusive video for free
Live Learn project team is dedicated to create exclusive videos

Real-time Quotes
View more faster market quotes

More comprehensive macro data and economic indicators
Members have access to entire historical data, guests can only view the last 4 years

Member-only Database
Comprehensive forex, commodity, and equity market data


The risk of loss in trading financial assets such as stocks, FX, commodities, futures, bonds, ETFs or crypto can be substantial. You may sustain a total loss of the funds that you deposit with your broker. Therefore, you should carefully consider whether such trading is suitable for you in light of your circumstances and financial resources.
No consideration to invest should be made without thoroughly conduct your own due diligence, or consult with your financial advisors. Our web content might not suit you, since we have not known your financial condition and investment needs. It is possible that our financial information might have latency or contains inaccuracy, so you should be fully responsible for any of your transactions and investment decisions. The company will not be responsible for your capital lost.
Without getting the permission from the website, you are not allow to copy the website graphics, texts, or trade marks. Intellectual property rights in the content or data incorporated into this website belongs to its providers and exchange merchants.