News
7x24
Quotes
Economic Calendar
Video
Data
- Names
- Latest
- Prev.

Latest Update

Risk Warning on Trading HK Stocks
Despite Hong Kong's robust legal and regulatory framework, its stock market still faces unique risks and challenges, such as currency fluctuations due to the Hong Kong dollar's peg to the US dollar and the impact of mainland China's policy changes and economic conditions on Hong Kong stocks.

HK Stock Trading Fees and Taxation
Trading costs in the Hong Kong stock market include transaction fees, stamp duty, settlement charges, and currency conversion fees for foreign investors. Additionally, taxes may apply based on local regulations.

HK Non-Essential Consumer Goods Industry
The Hong Kong stock market encompasses non-essential consumption sectors like automotive, education, tourism, catering, and apparel. Of the 643 listed companies, 35% are mainland Chinese, making up 65% of the total market capitalization. Thus, it's heavily influenced by the Chinese economy.

HK Real Estate Industry
In recent years, the real estate and construction sector's share in the Hong Kong stock index has notably decreased. Nevertheless, as of 2022, it retains around 10% market share, covering real estate development, construction engineering, investment, and property management.
View All

No data


Oil prices fell nearly 20% in 2025, marking Brent’s third straight annual loss, as oversupply fears driven by rising OPEC+ output, resilient U.S. shale production, and surging inventories outweighed geopolitical shocks.

Oil prices dropped lower in 2025 and show bearish price action which indicates further downside in 2026. Brent crude oil (BCO) and WTI crude oil (CL) recorded almost a 20% drop in 2025. This was Brent's third consecutive annual loss, which is the largest losing streak on record. On the other hand, the market sentiment turned negative as supply concerns were affected by the geopolitical tensions. Brent oil closed the year at $61 while the WTI oil closed at $57.
The prices failed to sustain gains despite the short term price increases from sanctions on Russia, Iran and Venezuela. Moreover, the conflicts between Iran and Israel did not induce any positive turn in the oil market. Moreover, OPEC+ has increased output by around 2.9 million barrels/day since April. U.S. shale producers hedged production at high prices, so that supply became more resilient to a decrease in prices. The EIA also reported record-high U.S. production in October, leading to more anxiety of a supply glut in 2026.
According to the recent data, a slight decrease in crude stocks is observed. However, the gasoline and distillate stocks show large accumulation. It is found that the US gasoline stocks increased 5.8 million barrels, which is far above expectations. On the other hand, the diesel and heating oil stocks added a million barrels to the oversupply fears. The decreased demand during the holiday period and negative price action during the last week of 2025 may put pressure on oil and natural gas prices in early 2026.
The daily chart for the U.S. Dollar Index indicates that the index settled at $57.40 on the last day of 2025. The price stays in the blue zone, which is a sign of strong bearish pressure on the oil prices. The prospect of downside breakouts in the area of $55 is on the rise. A break below $55 will trigger a heavy fall in the oil market.
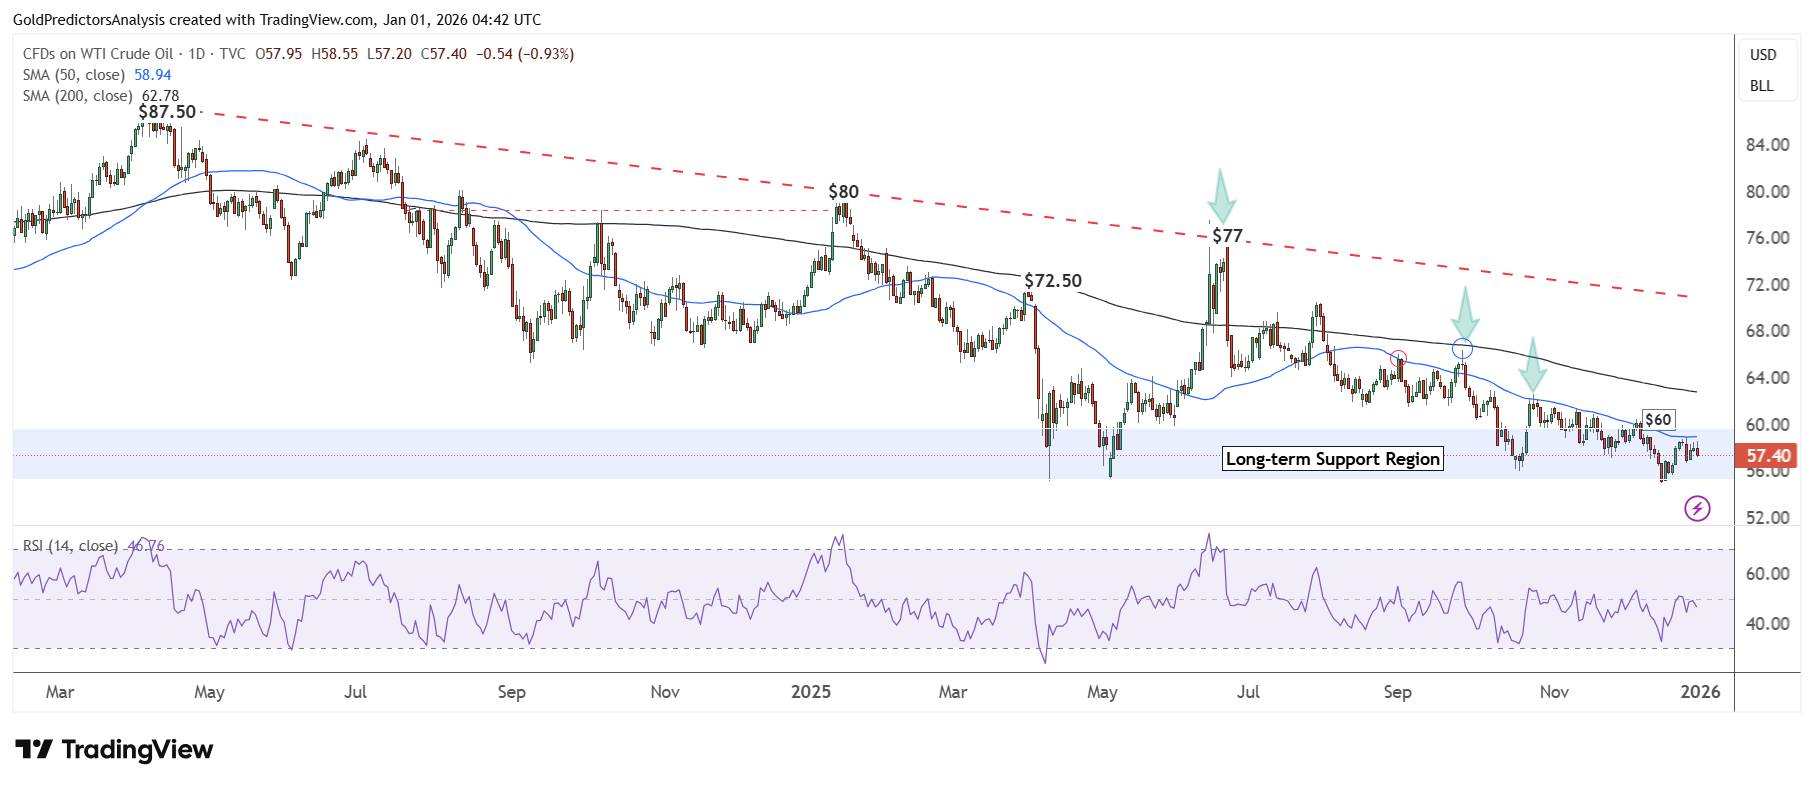
The 4-hour chart of WTI crude indicates that the price is moving within a descending broadening wedge pattern. These fluctuations are creating a negative price structure, with prices unable to break above the $60 area. Moreover, the RSI is also showing negative signals which is a sign of further downside.

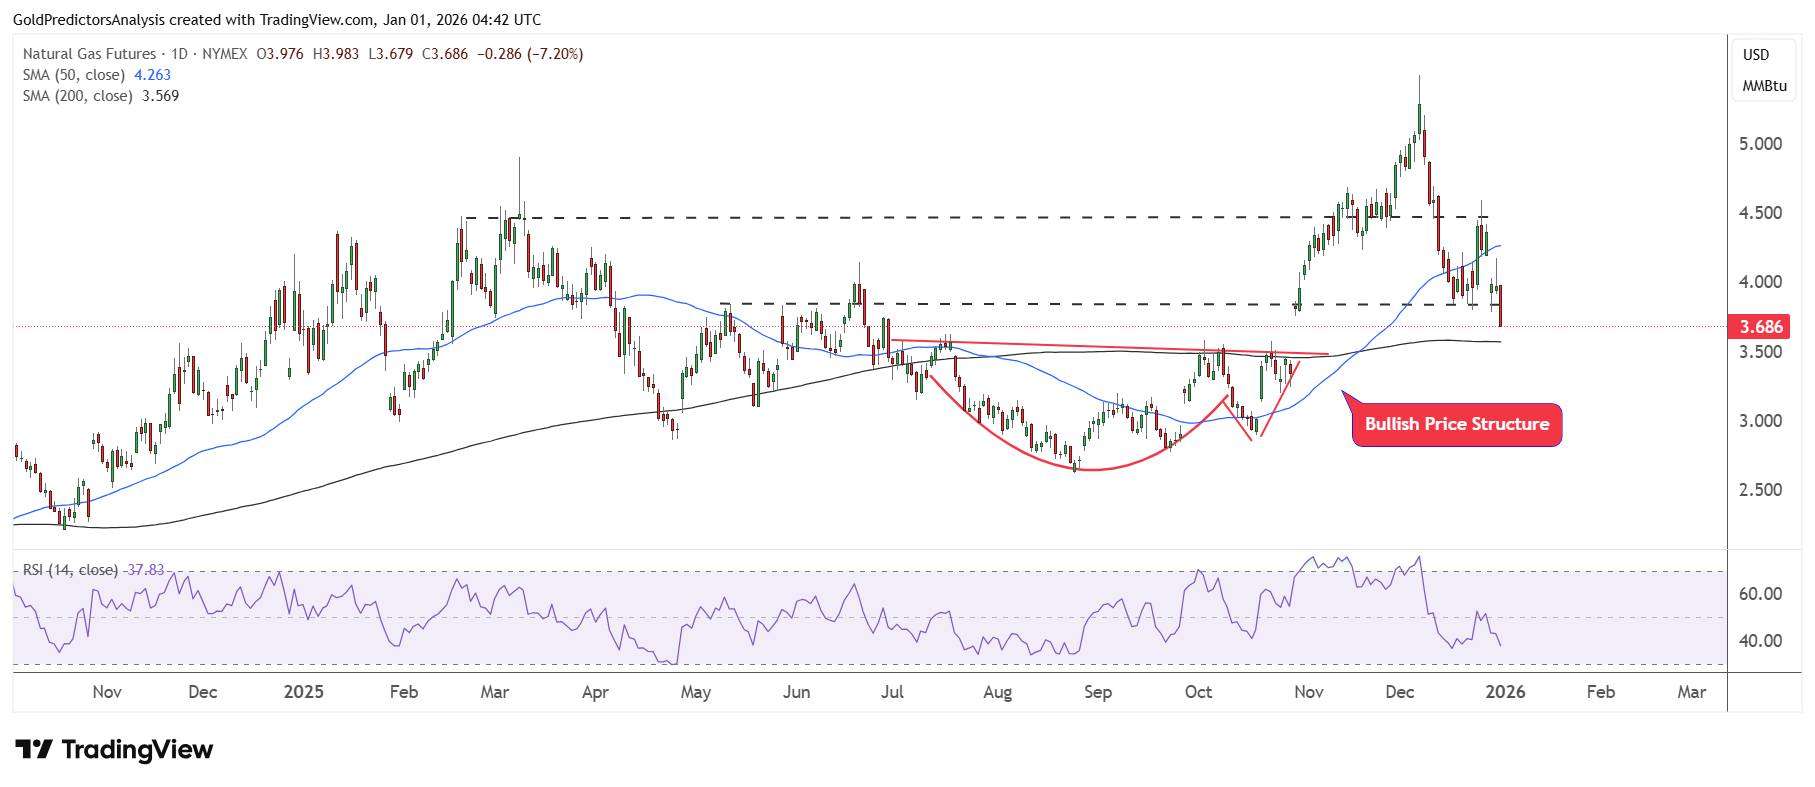
The daily chart for natural gas shows that natural gas prices moved between $4.50 to $3.80 before breaking lower. The natural gas price also fell on the last day of 2025, ending at $3.68. Immediate support is still in the vicinity of the $3.50 region at the 200-day SMA. However, the natural gas market is showing negative price action in the last month of 2025.
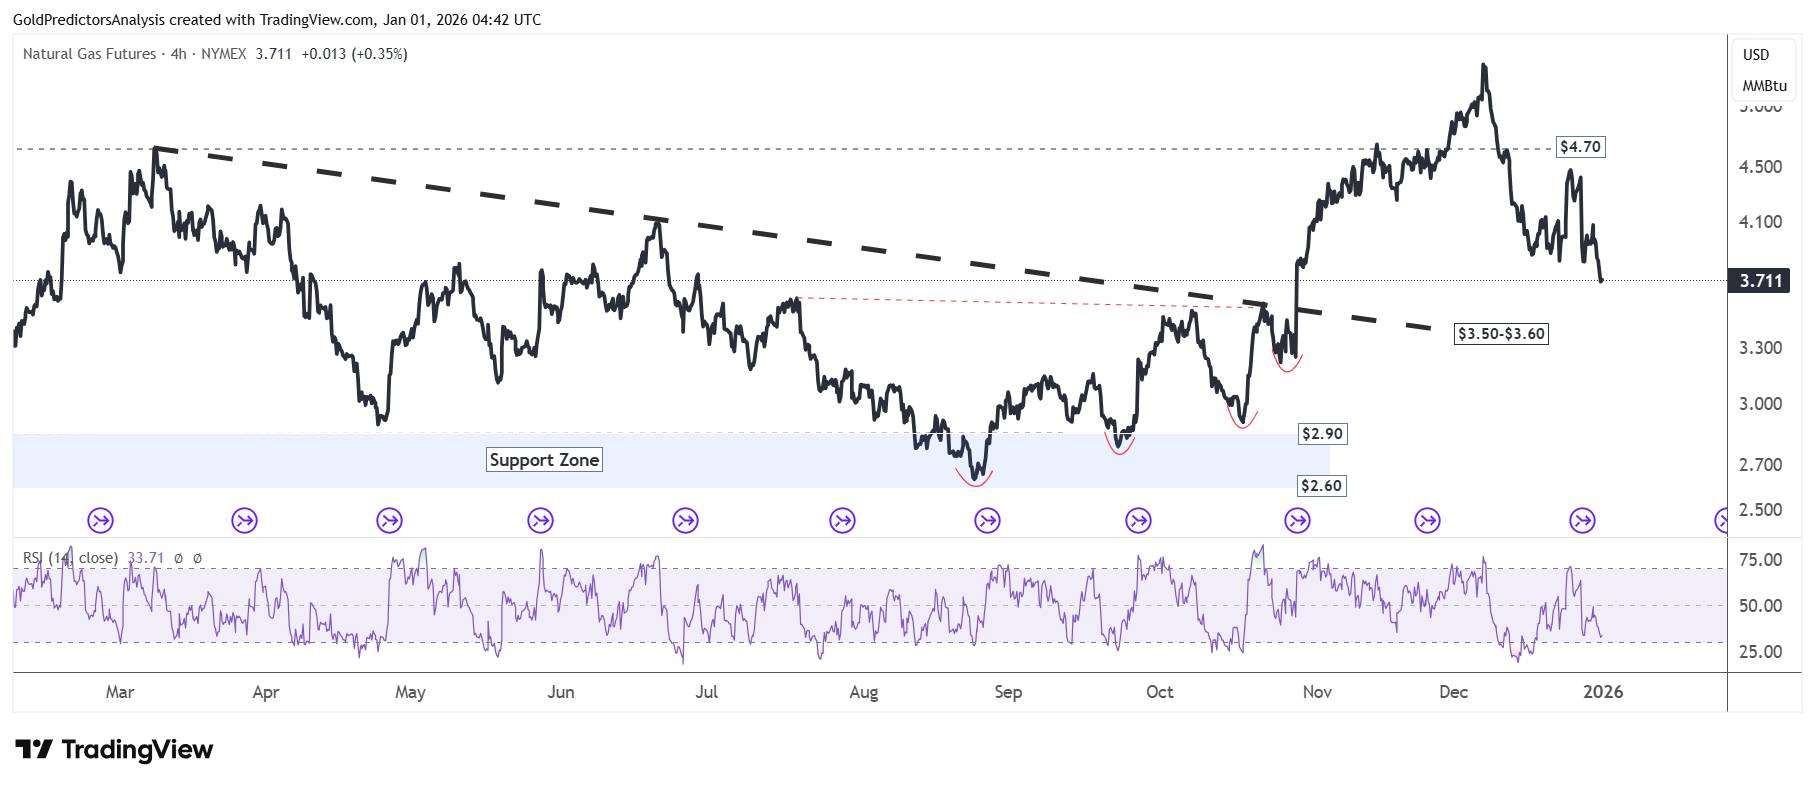
The 4-hour chart for natural gas also indicates that prices were unable to break above $4.70, which triggered negative momentum. The bearish nature of price action during the month of December indicates that 2026 may be a rough start with immediate support likely between the $3.50 to $3.00 area. A break below $2.50 would add to downside pressure in natural gas prices.
The daily chart of the U.S. Dollar Index shows that the index is moving around under thin liquidity conditions during the holiday period. Despite this fluctuation, the overall trend is bearish, and the index is likely to go lower in early 2026. A break below 96.50 would likely lead to a sharp drop in the U.S. Dollar Index to the 90.00 level.
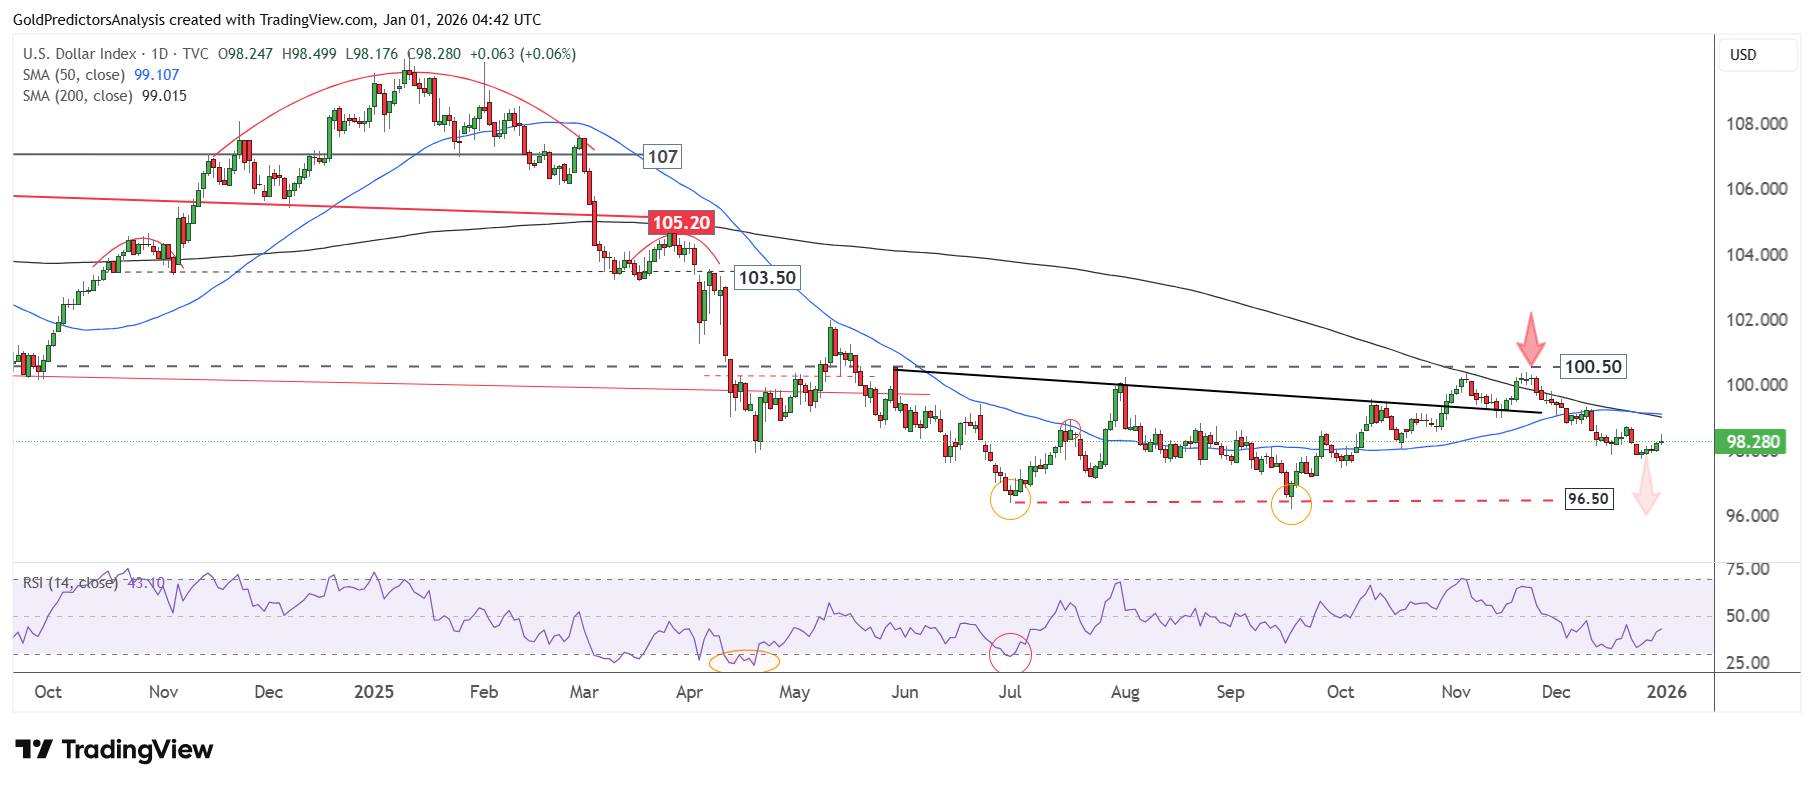
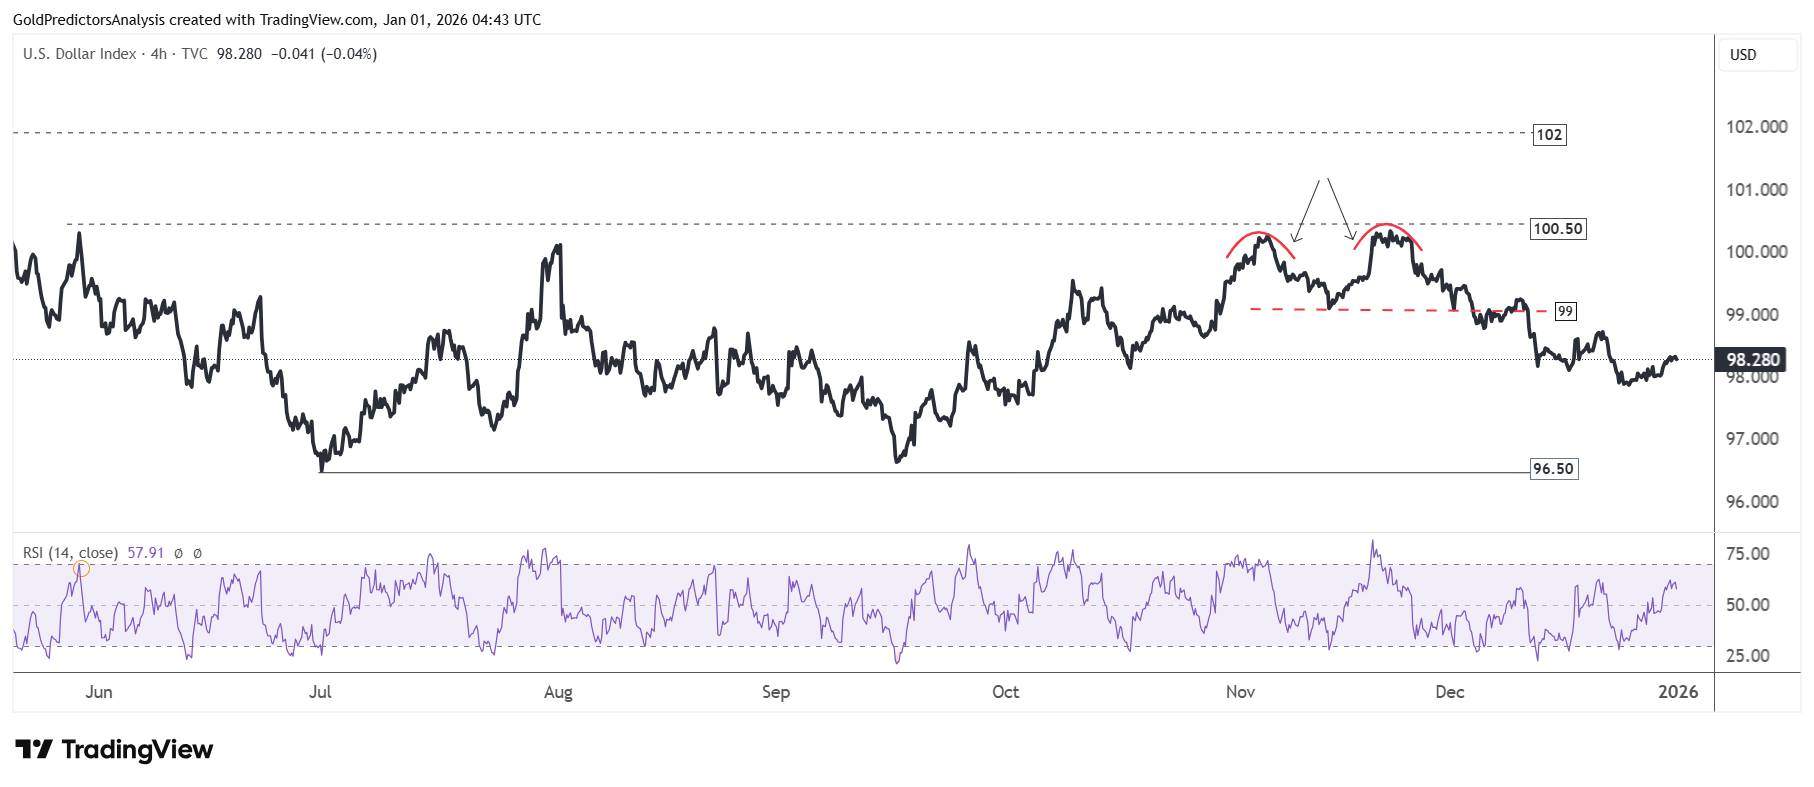
The 4 hour chart for U.S. Dollar Index shows the development of a double top pattern at 100.50 and then negative price action after breaking the 99.00 level. The strong consolidation between 96.50 and 100.50 means that the next major move in the U.S. Dollar Index will probably develop in the first quarter of 2026.

Quick Access to 7x24
Quick Access to More Editor-selected Real-time News

Exclusive video for free
FastBull project team is dedicated to create exclusive videos

Real-time Quotes
View more faster market quotes

More comprehensive macro data and economic indicators
Members have access to entire historical data, guests can only view the last 4 years

Member-only Database
Comprehensive forex, commodity, and equity market data


