News
7x24
Quotes
Economic Calendar
Video
Data
- Names
- Latest
- Prev.

Latest Update

Risk Warning on Trading HK Stocks
Despite Hong Kong's robust legal and regulatory framework, its stock market still faces unique risks and challenges, such as currency fluctuations due to the Hong Kong dollar's peg to the US dollar and the impact of mainland China's policy changes and economic conditions on Hong Kong stocks.

HK Stock Trading Fees and Taxation
Trading costs in the Hong Kong stock market include transaction fees, stamp duty, settlement charges, and currency conversion fees for foreign investors. Additionally, taxes may apply based on local regulations.

HK Non-Essential Consumer Goods Industry
The Hong Kong stock market encompasses non-essential consumption sectors like automotive, education, tourism, catering, and apparel. Of the 643 listed companies, 35% are mainland Chinese, making up 65% of the total market capitalization. Thus, it's heavily influenced by the Chinese economy.

HK Real Estate Industry
In recent years, the real estate and construction sector's share in the Hong Kong stock index has notably decreased. Nevertheless, as of 2022, it retains around 10% market share, covering real estate development, construction engineering, investment, and property management.
View All

No data


The US dollar struggles near 98 as Fed rate cuts loom into 2026, with GBP/USD holding trend support and EUR/USD testing key EMA levels.

On the first trading day of the year, the US Dollar Index (DXY) was closed, but it had previously traded at 98.25, not far off its peak of 98.44. It's shaping up to be a quiet start to the FX market, and so far, there's not much to get excited about for the Greenback.
The DXY, which compares the Greenback to six major currencies, is looking pretty underwhelming. It's about 2% below November's peak of 100.40.
In a nutshell, it's on track for a nearly 10% year-on-year decline, which would be its worst performance in eight years. No wonder investor sentiment is a bit downbeat given the erratic US trade policies and all the signs of an economic slowdown.
To top it off, there's the added pressure on the Federal Reserve to cut interest rates, which is eroding confidence in the bank's independence. You can see why the Dollar's status as the world's reserve currency is being questioned.
While most major central banks have finished raising their interest rates, the Federal Reserve in the US is still in the middle of cutting rates. As a result, the Dollar is struggling to get some traction because unlike many other countries, the US isn't tightening its policy anytime soon.
In addition, the latest US weekly Jobless Claims report came in lower than expected at 199K, down from the forecast of 219K and lower than last week's 215K.
As might be expected, this lower reading may give the US Dollar a bit of a boost. Although all things considered, there's still a lot of downward pressure on the Dollar.
This year is shaping up to be different for the US Dollar, because the Fed is still easing and there's still a lot of uncertainty. As a result, traders will be keeping a close eye on economic data and Federal Reserve statements to gauge how the Dollar might move in the short term.
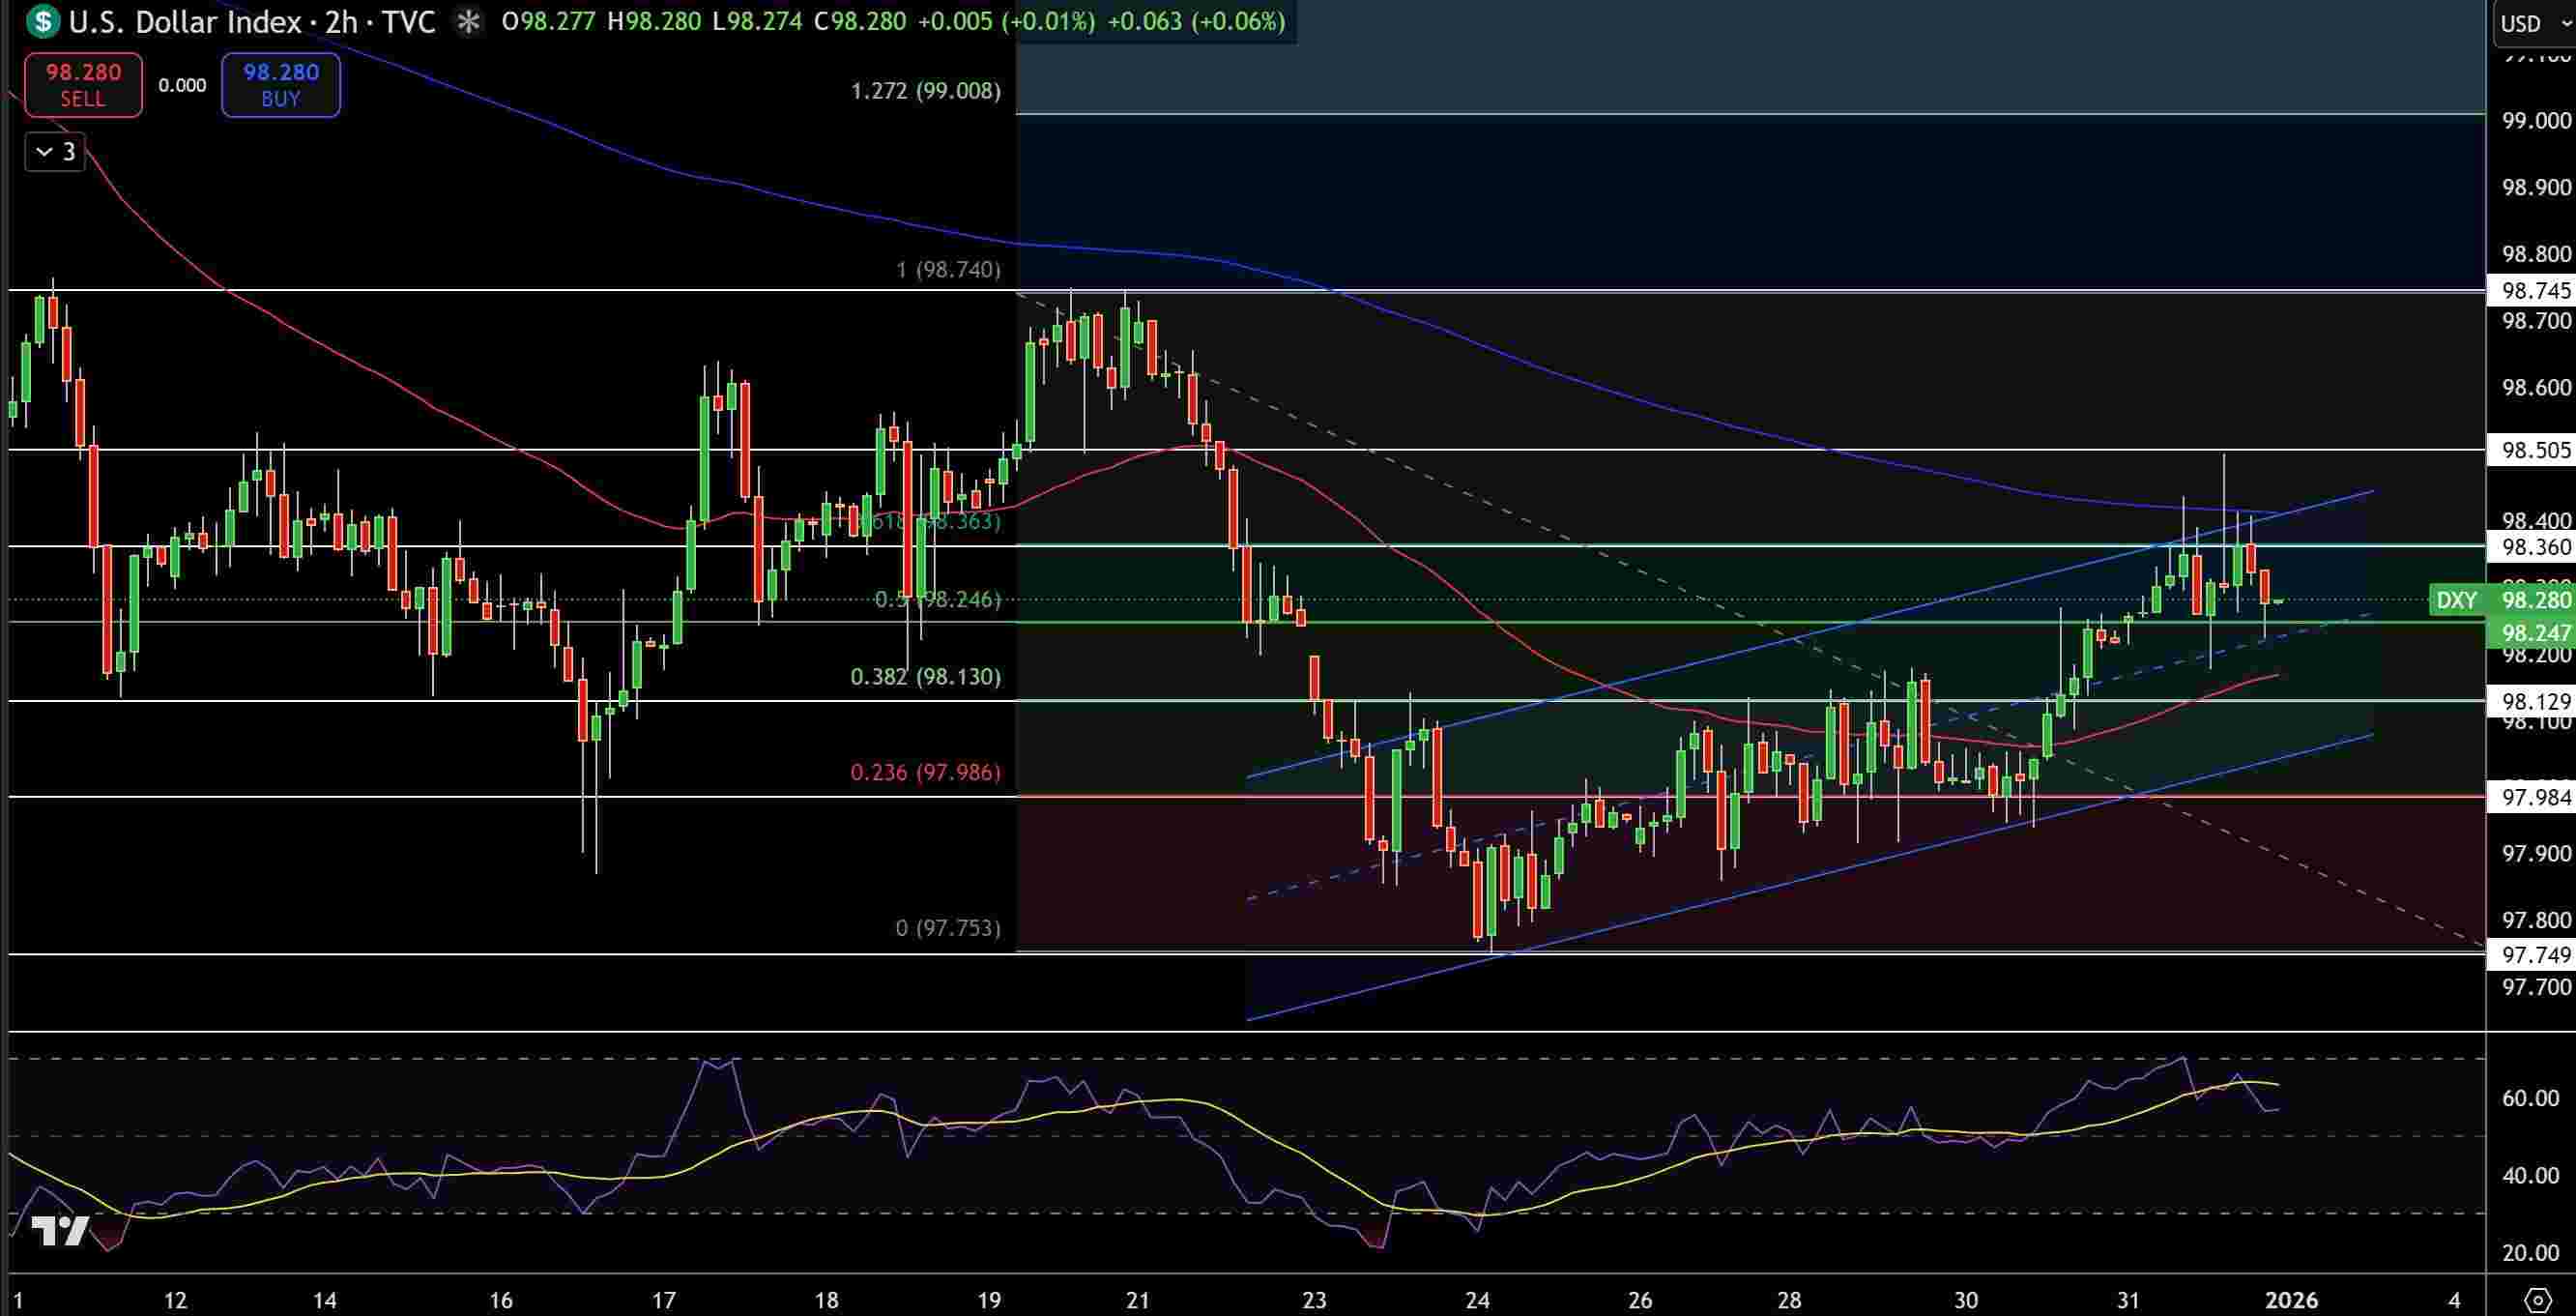 Dollar Index Price Chart – Source: Tradingview
The U.S. Dollar Index closed around $98.28 on December 31. Markets are closed on January 1, so we might need to wait a bit to see how things unfold. The price is still within a rising channel, but is vulnerable at the moment, as it has dipped below mid-range support near $98.25. The recent candles show smaller bodies and a bit of hesitation in price after the rebound from $97.75.
The 50-day Exponential Moving Average (50-EMA) is starting to creep higher around $98.10, but the 200-day EMA near $98.60 is still acting as a bit of a ceiling on the upside. Looking at Fibonacci retracement levels, $98.36 and $98.74 are acting as key resistance zones. The Relative Strength Index (RSI) is near 58, which suggests that there's a bit of modest momentum on the upside.
If the price can reclaim $98.36, the momentum could carry on towards $98.75, but a slip below $98.00 would weaken the momentum in the short term.
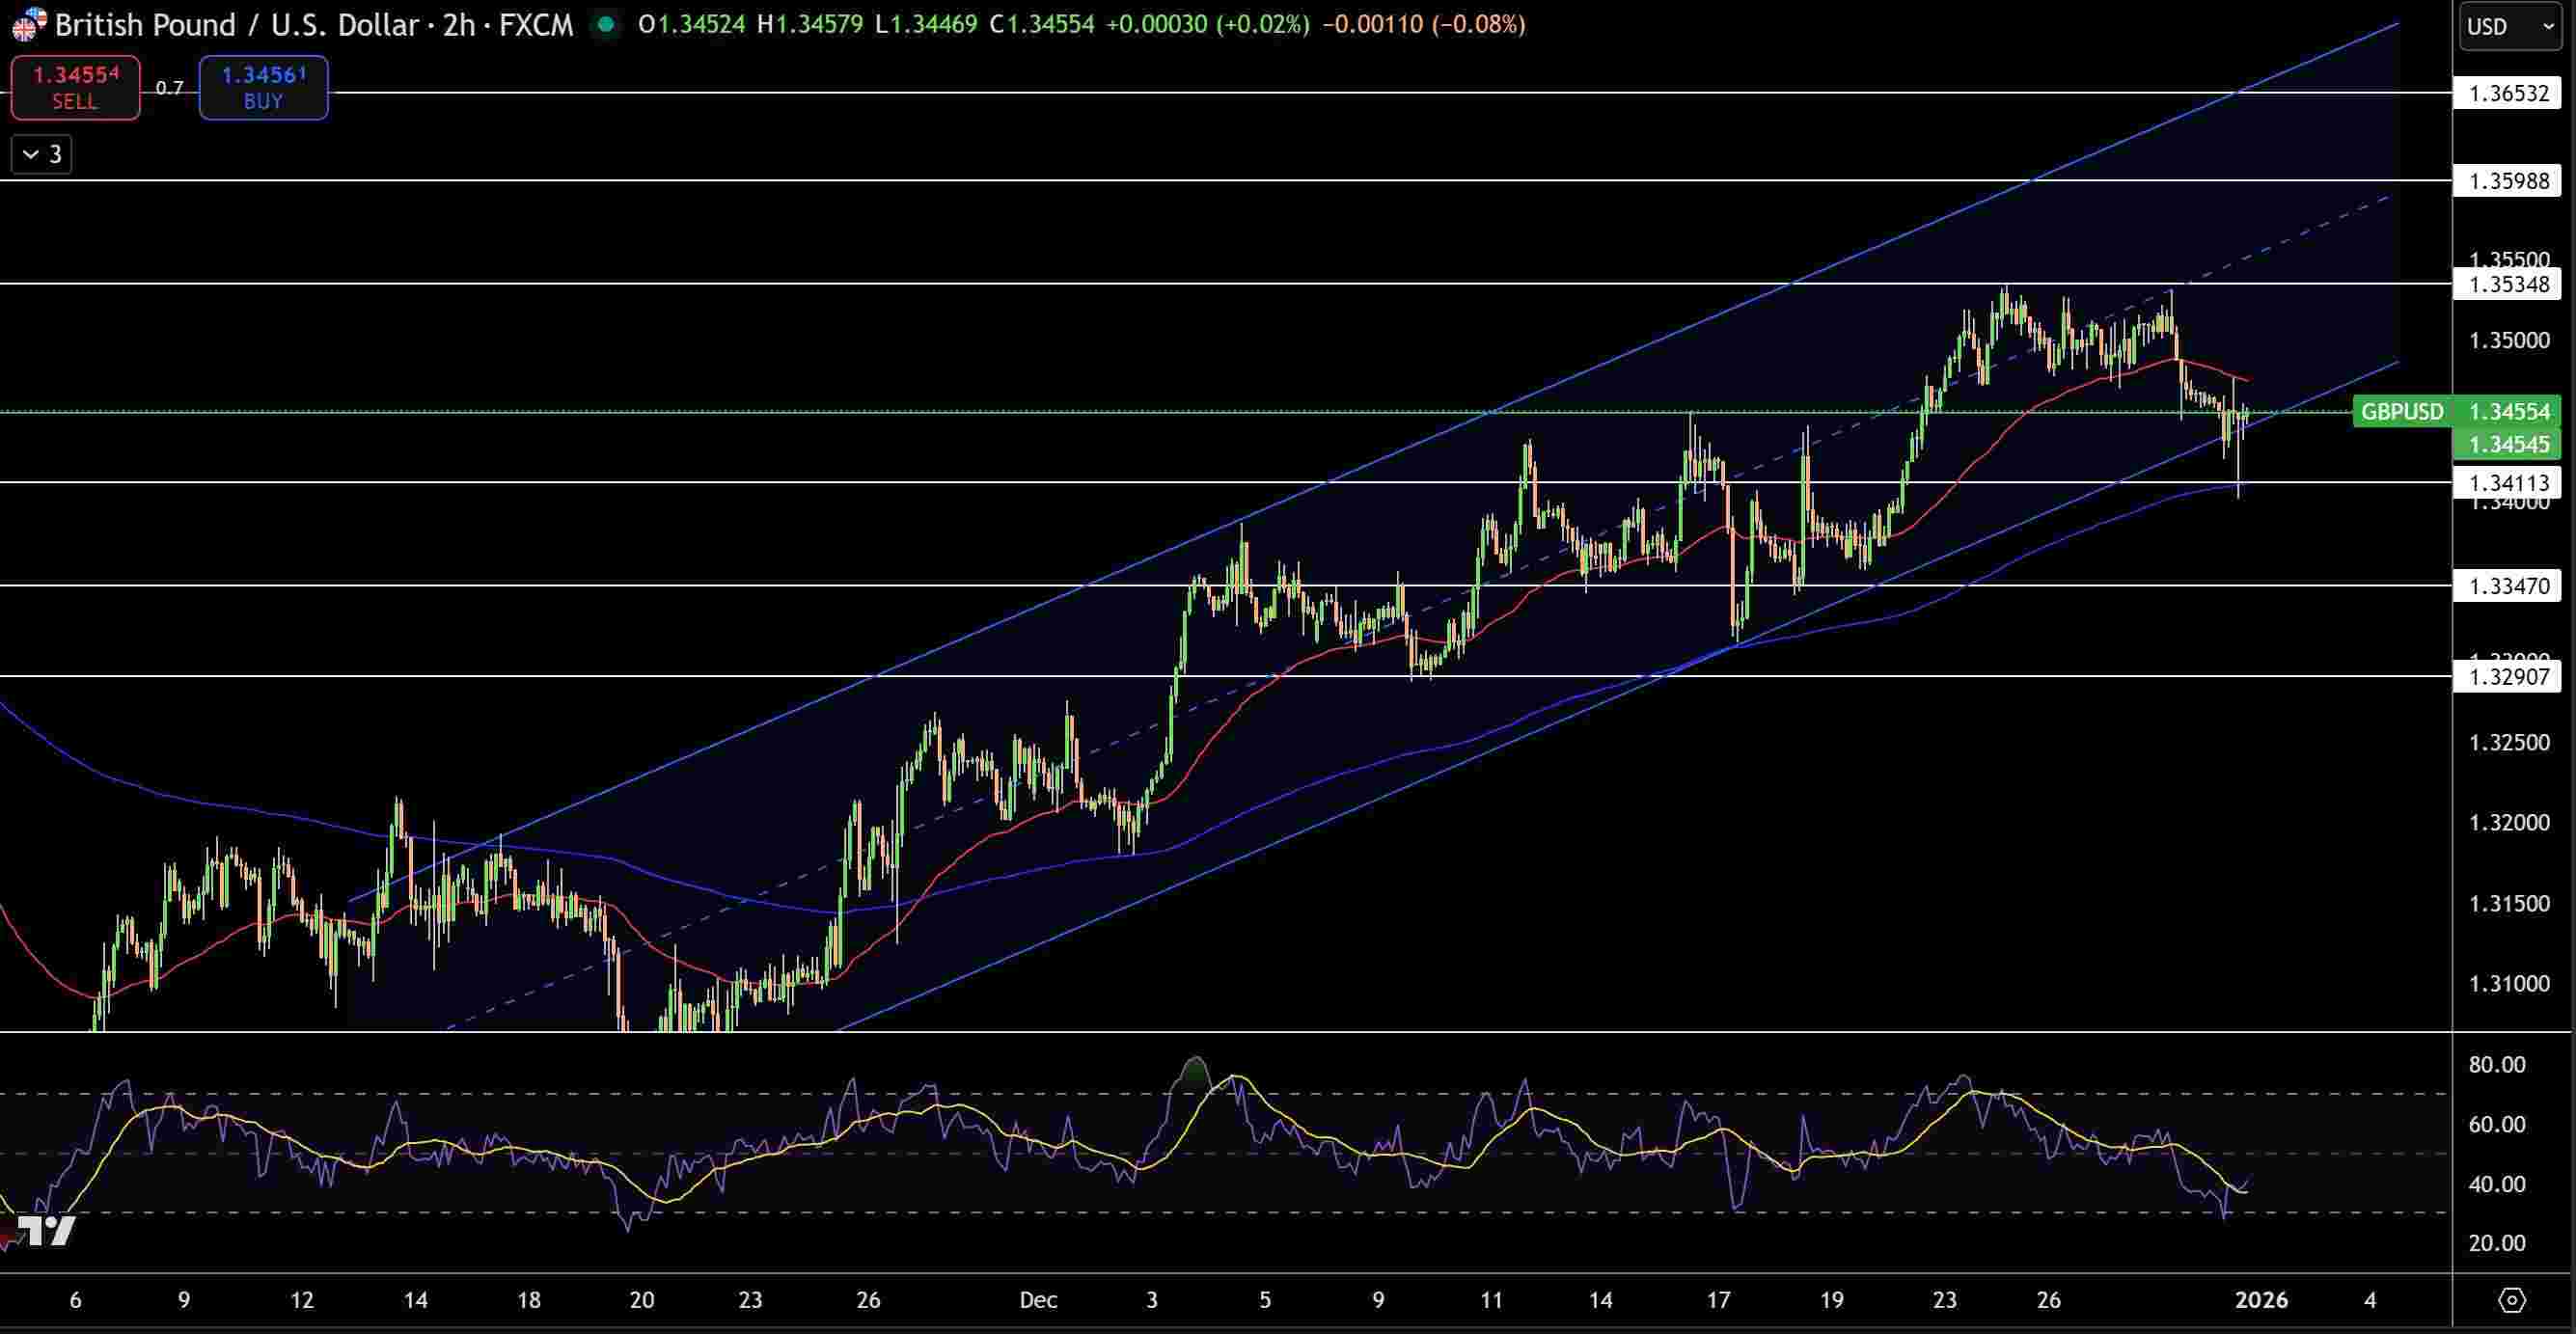 GBP/USD Price Chart – Source: Tradingview
GBP/USD closed at around $1.3455 on December 31, and the price has drifted back towards the 50-day EMA at $1.3460, but the 200-day EMA near $1.3410 remains strong trend support.
The recent candles are showing some rejection at the upper channel near $1.3530, suggesting we might be heading for short-term consolidation rather than a trend break. The RSI has eased back towards the low-40s, which is still not oversold, but it's a warning sign.
As we head back into the markets, a sustained hold above $1.3410 will keep the broader uptrend intact and make a break back towards $1.3500-$1.3535 a possibility. Of course, if the price breaks cleanly below $1.3410, then we'd need to look to $1.3345 as the next downside level.
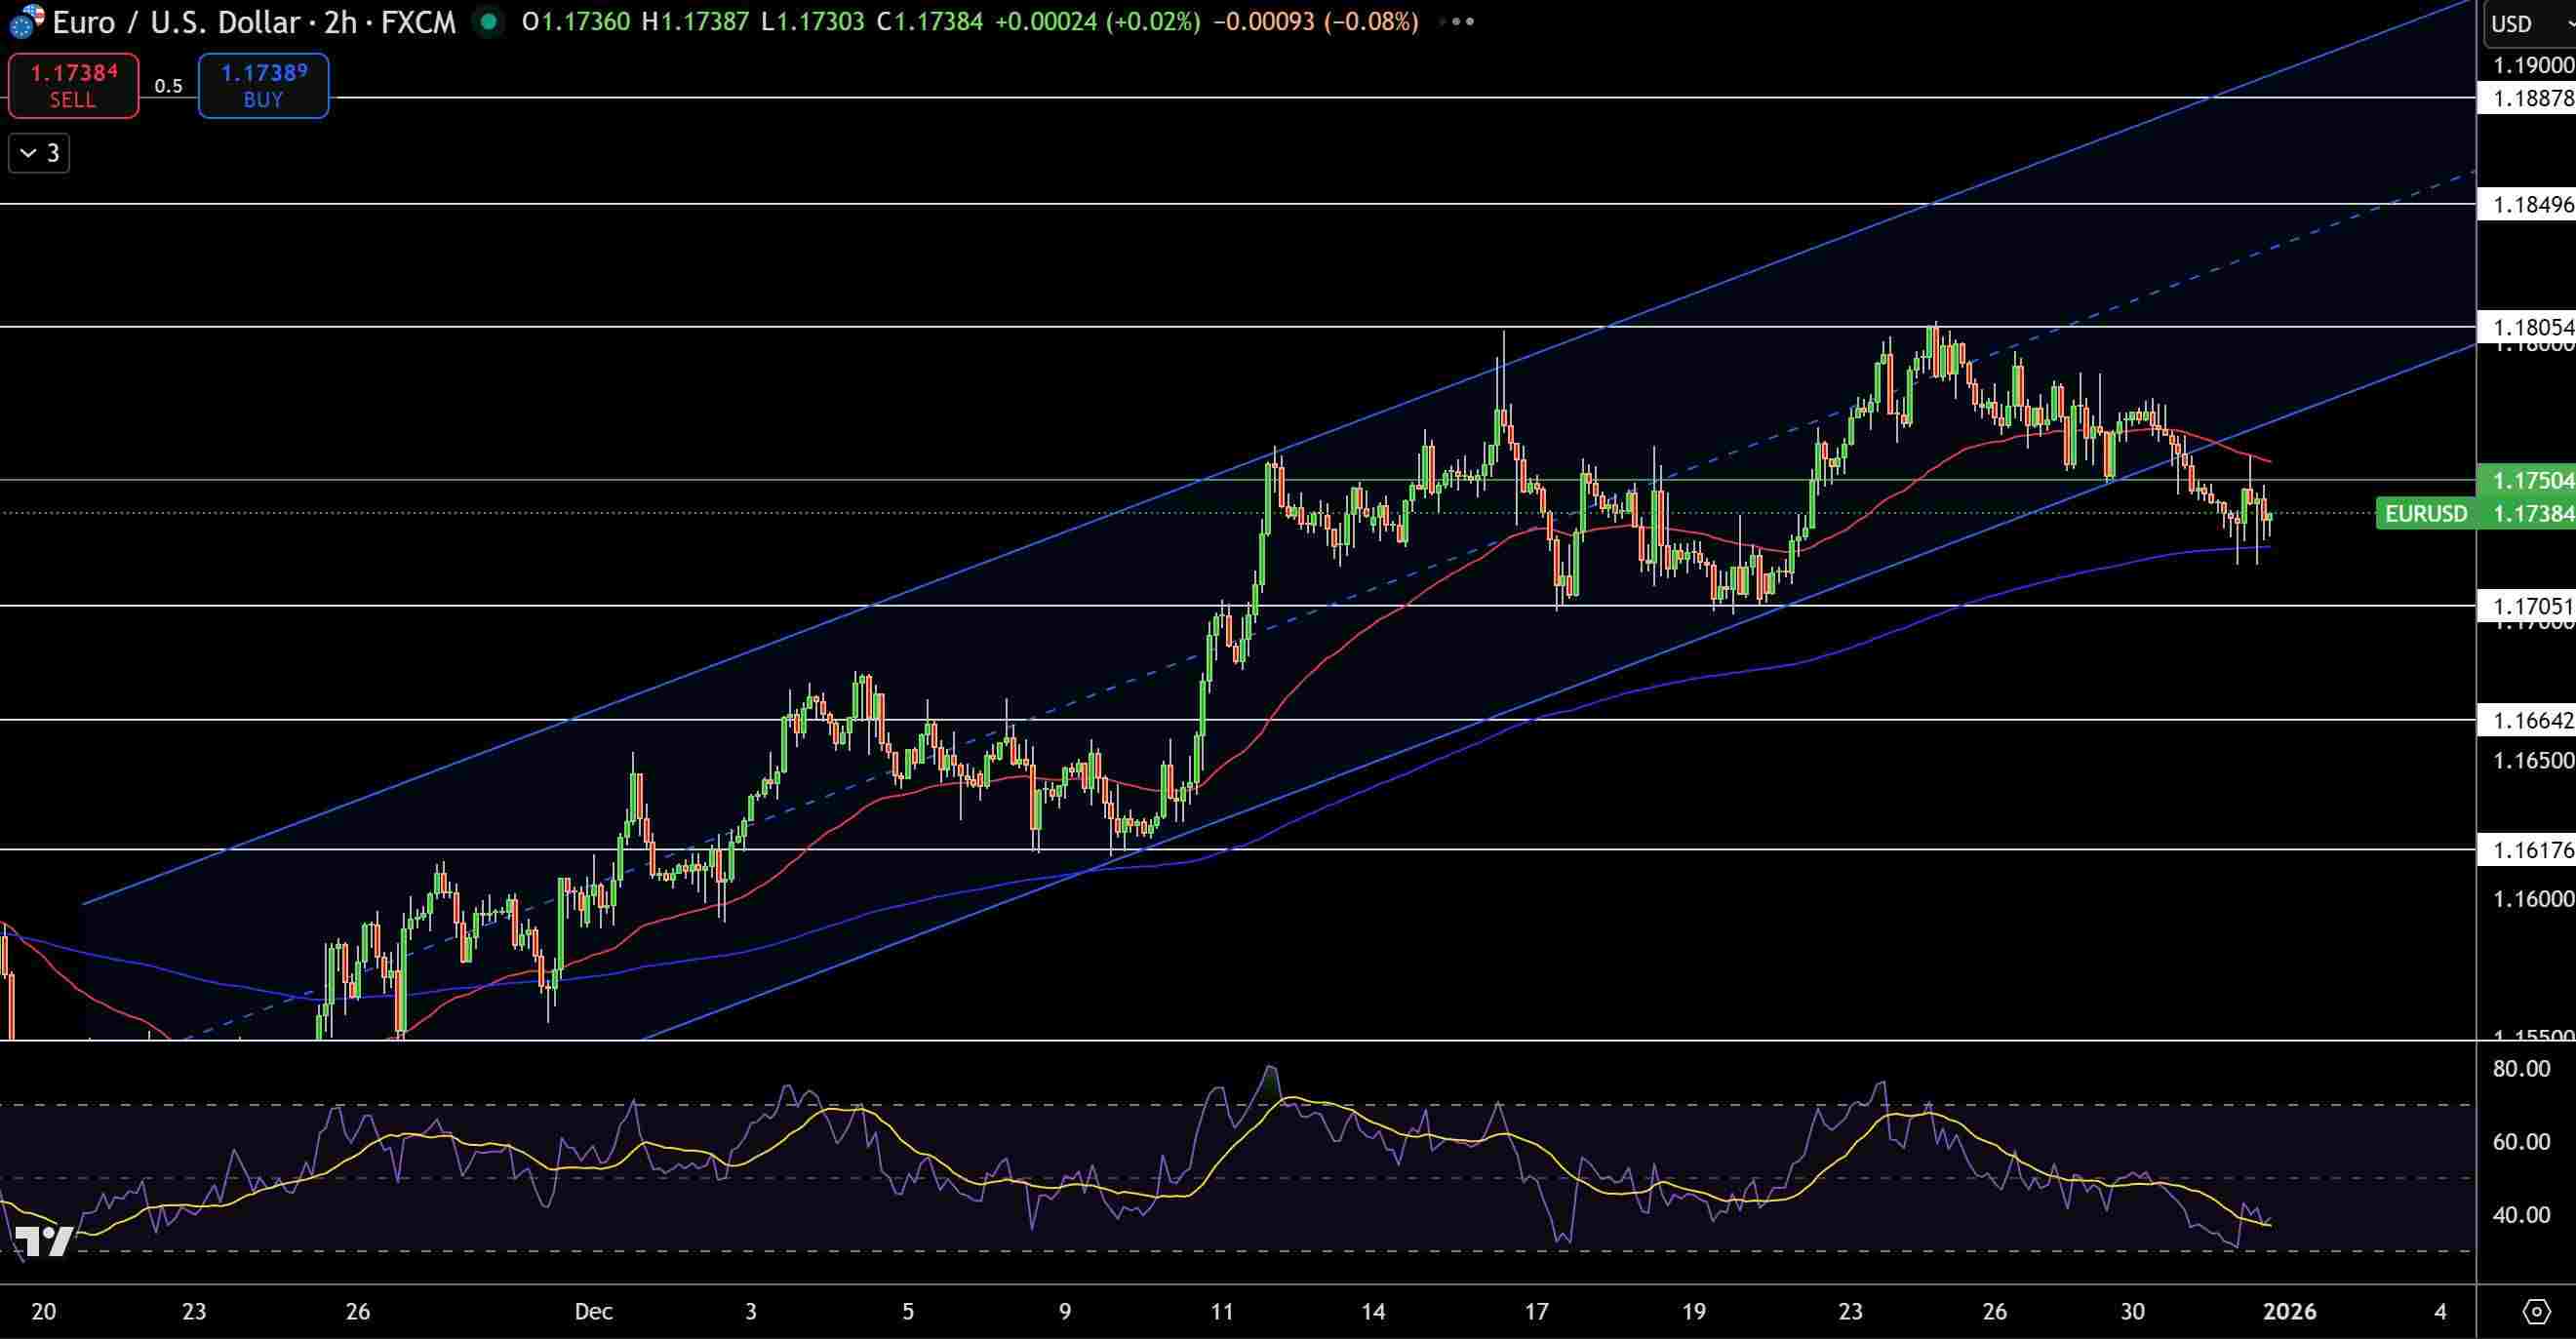 EUR/USD Price Chart – Source: Tradingview
EUR/USD closed at around $1.1738 on December 31 – and as you might expect, markets were a bit quiet as liquidity thins out at the start of the year. We are still holding just above the 50-day EMA near $1.1730, but the 200-day EMA around $1.1705 is still looking like a strong support zone.
RSI has started to slide towards 40, which suggests thats a fairly short-term bearish signal but it would take more to confirm a breakdown is under way.
For a rebound to gain some real traction we'd need to see a sustained bounce above $1.1765 , which might then set the stage for a push back up towards $1.1805. On the flipside, if we do manage to break clear of support at $1.1705 then $1.1665 would be a more likely next stop.

Quick Access to 7x24
Quick Access to More Editor-selected Real-time News

Exclusive video for free
FastBull project team is dedicated to create exclusive videos

Real-time Quotes
View more faster market quotes

More comprehensive macro data and economic indicators
Members have access to entire historical data, guests can only view the last 4 years

Member-only Database
Comprehensive forex, commodity, and equity market data


