Fundamental Analysis
Driven by last Friday's US September non-farm payrolls (NFP) report, GBP/USD opened significantly lower during the session, tumbling by nearly 600 fractional pips (60 pips). It has since edged up by 230 fractional pips to trade near the 1.32122 level.
Although UK inflationary pressures have rebounded markedly in recent months—with August CPI rising 3.1% YoY compared to 2.9% in July, and CPIH (including housing costs) reaching 3.3% as education, housing, and transport costs surged across the board—the single-sided impact of the US payroll data has left GBP/USD heavily skewed to the downside.
Last Friday's US NFP showed an addition of just 29,000 jobs in September, far below the forecasted 90,000. Prior months were also heavily revised downward: July was adjusted from +21,000 to -10,000, and August from +162,000 to +133,000—a combined net loss of 60,000 jobs relative to initial reports. In other words, the US labor market has indeed been cooling down over recent months, rather than in September alone.
Following the release, the CME FedWatch tool indicated a sharp pivot in market expectations for the Federal Reserve's October 27–28 meeting. The probability of a 25 bps rate hike dropped to around 22%, while the likelihood of holding rates steady in the 3.75%–4.00% range jumped to roughly 77.9%.
However, after digesting the data, the US Dollar Index reversed course and moved higher instead of falling. The underlying reason lies in the stark contrast between the two separate employment datasets in the September report: the Establishment Survey and the Household Survey.
The Establishment Survey yields the headline non-farm payroll figure (+29,000). In contrast, the Household Survey showed an increase of 406,000 employed persons, while the labor force grew by 485,000, pushing the labor force participation rate up from 61.6% to 61.8%.
These two surveys differ primarily in target populations, statistical methodologies, and sub-category handling. Briefly put, the Household Survey avoids double-counting: even if an individual holds multiple part-time jobs, they are counted only once. The Establishment Survey, however, counts every active payroll record—meaning a person working multiple jobs is counted multiple times—which occasionally distorts headline NFP figures. Consequently, the Household Survey offers a more conservative and ground-level perspective.
The Household Survey reveals a crucial fact: the current US labor market is characterized by "low hiring and low layoffs," rather than widespread corporate job cuts.
Another key signal comes from wages. Average hourly earnings for US private non-farm employees rose by just 0.1% MoM and 3.0% YoY in September, marking the slowest annual growth rate since May 2021, while average weekly hours held steady at 34.4.
While slowing wage growth is not a positive sign for job seekers, from the Fed's perspective, it indicates that labor-cost-driven inflationary pressures are easing.
Yet US inflation remains above target, framing the core macro picture: if the US economy continues to expand at a steady pace with inflation above 2%, and the labor market is transitioning from "overheated" to "low hiring, low layoffs," why would the Fed completely abandon rate hikes solely due to one soft NFP report?
The answer is: there is no such necessity.
What the September NFP changed was likely the timing of rate hikes, rather than the overall direction of monetary policy.
Therefore, traders should avoid focusing exclusively on the headline 29,000 NFP figure. Monetary policy decisions are dictated by the broader interplay among employment, inflation, and economic growth.
While the headline NFP print was undeniably weak, assessing it alongside the Household Survey, participation rate, unemployment rate, wage growth, jobless claims, and GDP growth indicates that the US economy is far healthier than the headline NFP implies. Reduced expectations for an October rate hike do not equate to the elimination of rate hikes within the year. This realization led the market to adjust its cognitive gap, providing fundamental backing for the US dollar's recovery.
Technical Analysis
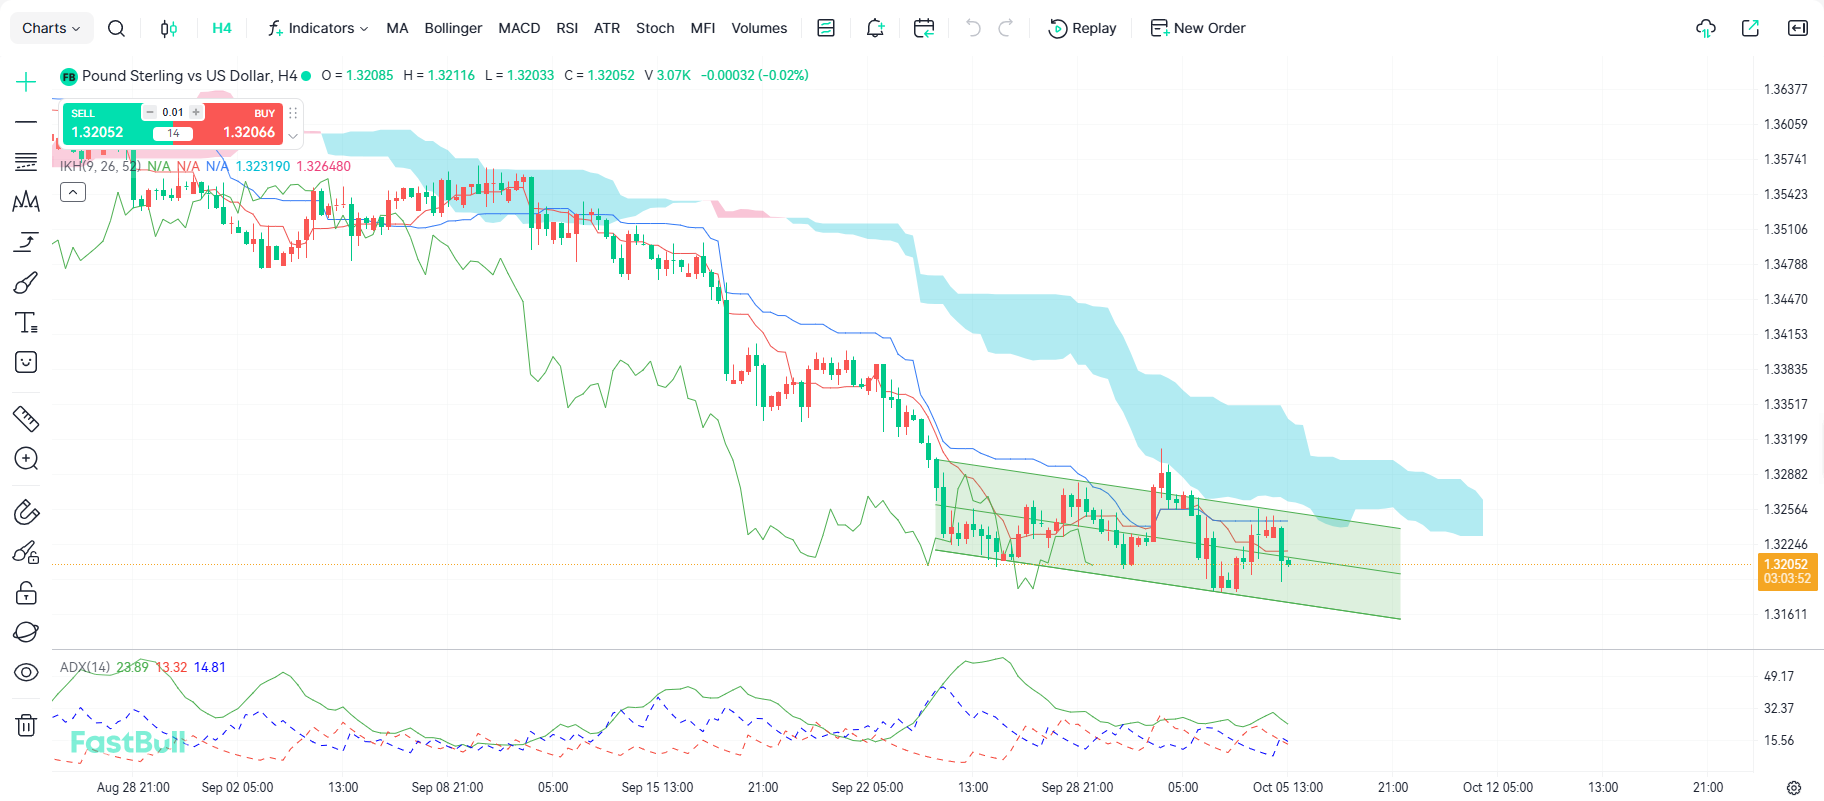
On the 4-hour chart, GBP/USD is consolidating at lower levels within a downward regression channel following its rapid sell-off, currently searching for a bottom between the channel's middle and lower rails. Key downside support rests at 1.31611, where the lower channel rail converges with recent swing lows; a breakdown below this line would disrupt the channel consolidation structure and trigger a new leg lower. Key upside resistance sits in the 1.32648–1.32882 zone (the confluence of the upper channel rail and the Ichimoku Kijun-sen), with stronger overhead resistance located at the lower bound of the thick bearish cloud (around 1.33199–1.33517). GBP/USD remains capped below the cloud and mid-channel rail, though whether it can establish a base around 1.31611 to launch a rebound requires further observation.
In terms of technical indicators, within the Ichimoku system, the Tenkan-sen (red line, ~1.32648) and Kijun-sen (blue line, ~1.32319) have formed a bearish dead cross, while price (1.32052) trades well below the thick bearish cloud (Senkou Span A/B), confirming that short-to-medium-term momentum remains dominated by sellers.
In the ADX indicator, the ADX line (green line, 23.89) is flattening at low levels, while +DI (red line, 13.32) and -DI (blue line, 14.81) are tightly intertwined, indicating that downside momentum has decelerated following the initial sharp drop and transitioned into a weak consolidation phase. Given that the current price (1.32052) sits extremely close to the lower channel rail and the key support zone at 1.31611, the probability of price stabilizing to launch an oversold technical bounce is elevated.
Trading Recommendations
Direction: Buy / Long
Entry: 1.31800
Target: 1.32800
Stop Loss: 1.31300
Support Levels: 1.31611, 1.31300, 1.31000
Resistance Levels: 1.32319, 1.32648, 1.32882


