XAUUSD
4165.81

0.13%

WTI
98.882

2.91%

EURUSD
1.12378

0.16%

GBPUSD
1.33269

0.39%

USDJPY
157.971

0.01%

USNDAQ100
29209.40

2.26%

Global Markets

Economic Calendar
7x24
Quotes

Video

Latest Update

Risk Warning on Trading HK Stocks

Despite Hong Kong's robust legal and regulatory framework, its stock market still faces unique risks and challenges, such as currency fluctuations due to the Hong Kong dollar's peg to the US dollar and the impact of mainland China's policy changes and economic conditions on Hong Kong stocks.

HK Stock Trading Fees and Taxation

Trading costs in the Hong Kong stock market include transaction fees, stamp duty, settlement charges, and currency conversion fees for foreign investors. Additionally, taxes may apply based on local regulations.

HK Non-Essential Consumer Goods Industry

The Hong Kong stock market encompasses non-essential consumption sectors like automotive, education, tourism, catering, and apparel. Of the 643 listed companies, 35% are mainland Chinese, making up 65% of the total market capitalization. Thus, it's heavily influenced by the Chinese economy.

HK Real Estate Industry

In recent years, the real estate and construction sector's share in the Hong Kong stock index has notably decreased. Nevertheless, as of 2022, it retains around 10% market share, covering real estate development, construction engineering, investment, and property management.

Analysis
Data

Data Warehouse Market Trend Institutional Data Policy Rates Macro

Market Trend

Speculative Sentiment Orders and Positions Correlation

Popular Indicators

Pro
AI Signal

Trading Signals

AI Signal

News
Recent Searches
    Trending Searches
      News
      7x24
      Quotes
      Economic Calendar
      Video
      Data
      • Names
      • Latest
      • Prev.

      View All

      No data

      Sign in

      Sign up

      --

      • My Favorites
      • My Subscription
      • Profile
      • Orders
      • Account Settings
      • Sign out
      Reminder Settings
      • Economic Calendar
      • Quotes/Market Quotes

      Reminders Temporarily Unavailable

      FastBull Membership Privileges
      Quick Access to 7x24
      Quick Access to More Editor-selected Real-time News
      Real-time Quotes
      View more faster market quotes
      Upgrade to {0} Pro
      I have read and agreed to the
      Pro Policy
      Feedback
      0 /250
      0/4
      Contact Information
      Submit

      Gold Prices Oscillate Ahead of Key Resistance

      Summary:

      Gold/USD is currently in a low-level range-bound base-building phase. Following an earlier unilateral decline, price action has entered a consolidation process within the bottom of its trading range.

      Buy XAUUSD
      EXP
      PENDING

      4145.00

      ENTRY

      4220.00

      TGT

      4100.00

      SL

      4165.81 -5.39 -0.13%

      --

      Point

      PENDING

      4100.00

      SL

      CLOSING

      4145.00

      ENTRY

      4220.00

      TGT
      Fundamental

      Remarks by Federal Reserve officials have served as a central catalyst behind the recent rebound in gold prices. Although the US September CPI report exceeded expectations (rising 3.7% YoY) and initially sparked rate-hike fears, multiple Fed officials issued dense wait-and-see signals that effectively cooled aggressive market rate-hike expectations. Fed Governor Bowman, Chicago Fed President Goolsbee, and San Francisco Fed President Daly all indicated on October 15 that there is no rush to raise rates, favoring a data-dependent stance. Consequently, market expectations for the Federal Reserve to keep interest rates unchanged at its October meeting rose to 71.8%, while the probability of a rate increase dropped significantly to 28.2%. This shift in sentiment pulled the 10-year US Treasury yield back to 5.15% and sent the US Dollar Index down roughly 1% to 101.78, with weaker real yields and dollar weakness providing substantial relief to gold valuations.
      Meanwhile, US September PPI data released on the evening of October 15 showed headline PPI surging 6.3% YoY and core PPI accelerating to 5.0%—both coming in above market forecasts and pointing to sticky upstream inflationary pressures. While the dollar and Treasury yields softened briefly following the release to support gold, upcoming strong economic prints, such as retail sales, could still prompt markets to reprice the rate path.
      Additionally, geopolitical risks continue to offer underlying support for bullion. Ongoing Middle East tensions have sustained safe-haven demand, partially offsetting headwinds from a high-interest-rate environment. Furthermore, sustained central bank accumulation alongside record Q3 ETF net inflows of $31 billion demonstrate that institutional allocation flows are providing a solid floor for gold prices.

      Technical

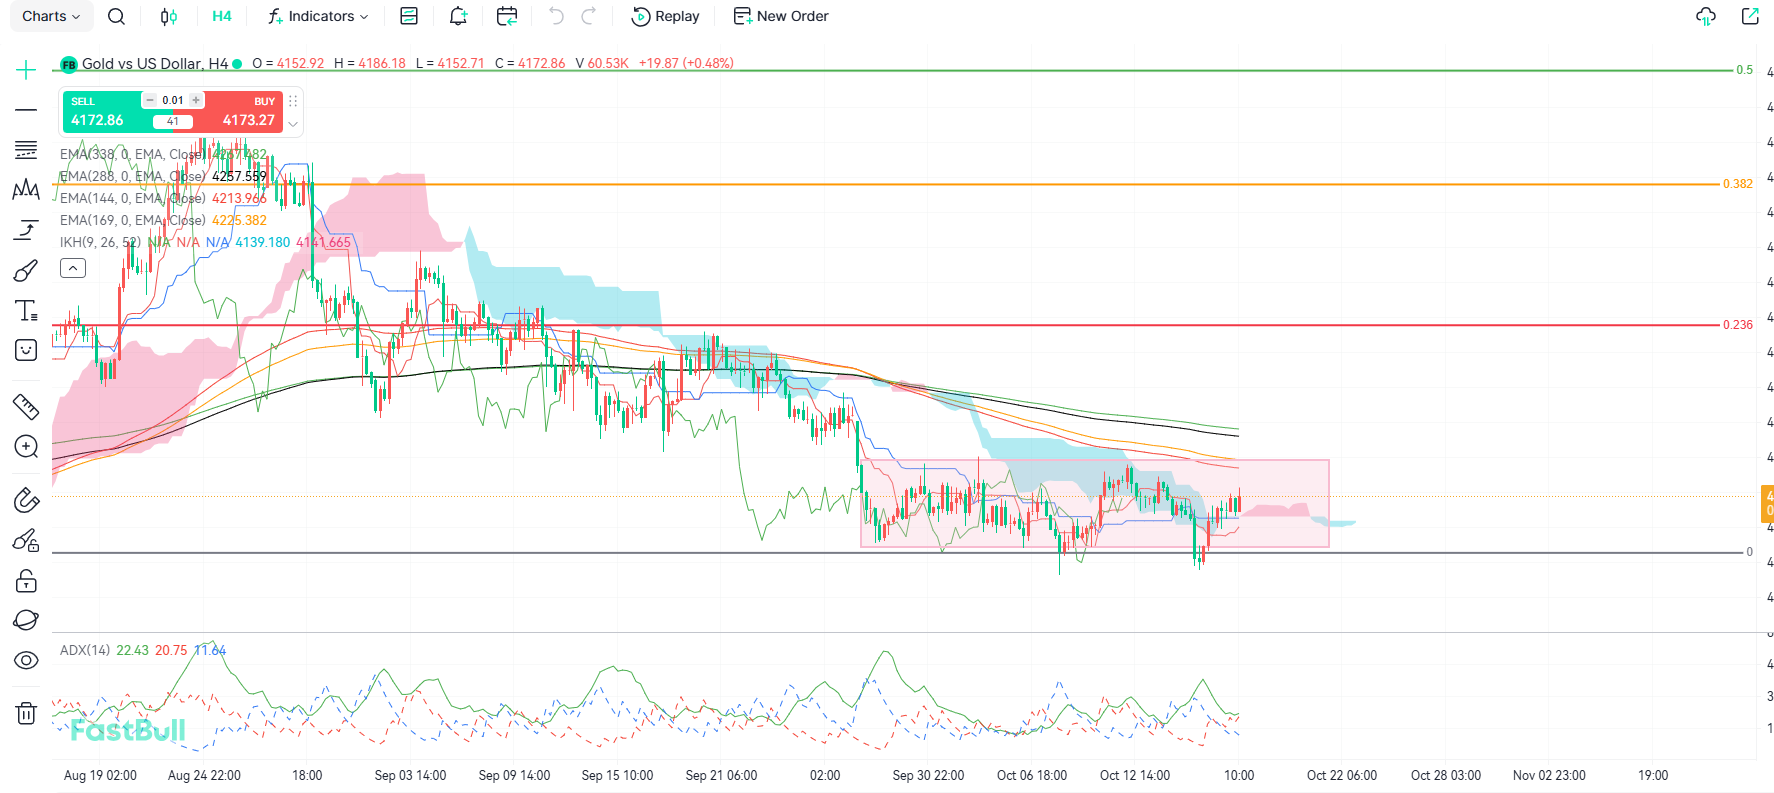
      On the 4-hour chart, Gold/USD is consolidating within a low-level horizontal range. Following its previous sharp decline, price action has entered a whipsaw consolidation phase inside a bottom pink box (4110.00–4225.00 range), remaining constrained under the dual-tunnel system and the Ichimoku cloud structure. Key downside support rests at the base of the pink range and the horizontal baseline zero line (4110.00–4120.00 area); a breakdown below this defensive line would trigger a deeper correction lower. Key upside resistance sits in the 4225.38–4257.56 zone, where the upper bound of the range coincides with the 0.236 Fibonacci retracement level and a dense confluence zone formed by the inner fast tunnel (EMA 144/169) and outer slow tunnel (EMA 288/338). Gold/USD remains under pressure below both the dual tunnels and the cloud, though whether it can base near the range bottom to initiate a corrective rebound requires further observation.
      In terms of technical indicators, within the Ichimoku system, the Tenkan-sen (red line, 4141.665) and Kijun-sen (blue line, 4139.180) are intertwined at low levels, while the current price (4172.86) trades below the cloud near the midline of the box, displaying characteristic low-level convergent consolidation.
      In the ADX indicator, the ADX line (green line, 22.43) is flattening at low levels, while the spread between +DI (red line, 20.75) and -DI (blue line, 11.64) has narrowed, signaling that the momentum of the earlier unilateral drop has largely exhausted as the market moves into a range repair phase. Given that price has repeatedly found support near 4110.00 with lower shadows, the probability is high that Gold/USD will stabilize near the lower boundary of the range (4130.00–4150.00 zone) to launch a technical corrective bounce toward the top of the box and the tunnel resistance zone.Gold Prices Oscillate Ahead of Key Resistance_1

      Trading Recommendations

      Direction: Buy / Long
      Entry: 4145.00
      Target: 4220.00
      Stop Loss: 4100.00
      Support Levels: 4141.66, 4110.00, 4066.00
      Resistance Levels: 4213.96, 4225.38, 4257.55
      Risk Warnings and Investment Disclaimers
      You understand and acknowledge that there is a high degree of risk involved in trading with strategies. Following any strategies or investment methodologies is the potential for loss. The content on the site is being provided by our contributors and analysts for information purposes only. You alone are solely responsible for determining whether any trading assets, or securities, or strategy, or any other product is suitable for you based on your investment objectives and financial situation.

      Quick Access to 7x24

      Quick Access to More Editor-selected Real-time News

      Exclusive video for free

      FastBull project team is dedicated to create exclusive videos

      Real-time Quotes

      View more faster market quotes

      More comprehensive macro data and economic indicators

      Members have access to entire historical data, guests can only view the last 4 years

      Member-only Database

      Comprehensive forex, commodity, and equity market data

      Jason

      Analysts

      I have an in-depth study of fundamentals, especiaslly for the US dollar market. I'm good at short and medium term trading by virtue of my profound financial theoretical knowledge and extensive practical experience.

      Rank

      6

      Articless

      475

      Win Rate

      42.17%

      P/L Ratio

      0.93

      Focus on

      USDX, EURUSD, XAUUSD

      Related Analysis

      Gold Prices Oscillate Ahead of Key Resistance

      PENDING

      Non-Farm "Black Swan" Fails to Shift Yield Spread Fundamentals; Battle Around 158 Level Intensifies

      PROFIT +79 Points

      Non-Farm "Black Swan" Fails to Shift Yield Spread Fundamentals; Battle Around 158 Level Intensifies

      PROFIT +72 Points

      GBP Plunges over 60 Pips, Short-Term Rebound Expected

      EXPIRED

      GBP Plunges over 60 Pips, Short-Term Rebound Expected

      EXPIRED
      FastBull
      English
      English
      العربية
      繁體中文
      简体中文
      Bahasa Melayu
      Bahasa Indonesia
      ภาษาไทย
      Tiếng Việt
      Economic Calendar 7x24 Quotes Video Analysis Data Warehouse Pro AI Signal News