Global Markets

Economic Calendar
7x24
Quotes

Video

Trading Academy

Latest Update

Risk Warning on Trading HK Stocks

Despite Hong Kong's robust legal and regulatory framework, its stock market still faces unique risks and challenges, such as currency fluctuations due to the Hong Kong dollar's peg to the US dollar and the impact of mainland China's policy changes and economic conditions on Hong Kong stocks.

HK Stock Trading Fees and Taxation

Trading costs in the Hong Kong stock market include transaction fees, stamp duty, settlement charges, and currency conversion fees for foreign investors. Additionally, taxes may apply based on local regulations.

HK Non-Essential Consumer Goods Industry

The Hong Kong stock market encompasses non-essential consumption sectors like automotive, education, tourism, catering, and apparel. Of the 643 listed companies, 35% are mainland Chinese, making up 65% of the total market capitalization. Thus, it's heavily influenced by the Chinese economy.

HK Real Estate Industry

In recent years, the real estate and construction sector's share in the Hong Kong stock index has notably decreased. Nevertheless, as of 2022, it retains around 10% market share, covering real estate development, construction engineering, investment, and property management.

Analysis
Data

Data Warehouse Market Trend Institutional Data Policy Rates Macro

Market Trend

Speculative Sentiment Orders and Positions Correlation

Popular Indicators

Pro
AI Signal

Trading Signals

AI Signal

News
Recent Searches
    Trending Searches
      News
      7x24
      Quotes
      Economic Calendar
      Video
      Data
      • Names
      • Latest
      • Prev.

      View All

      No data

      Sign in

      Sign up

      --

      • My Favorites
      • My Subscription
      • Profile
      • Orders
      • Account Settings
      • Sign out
      Reminder Settings
      • Economic Calendar
      • Quotes/Market Quotes

      Reminders Temporarily Unavailable

      Live Learn Membership Privileges
      Quick Access to 7x24
      Quick Access to More Editor-selected Real-time News
      Real-time Quotes
      View more faster market quotes
      Upgrade to {0} Pro
      I have read and agreed to the
      Pro Policy
      Feedback
      0 /250
      0/4
      Contact Information
      Submit

      Triangle Breakout Achieved: Is Gold Heading Straight for $4,000?

      EconomicCommodityForexTechnical Analysis
      Summary:

      The ISM Manufacturing PMI for August is expected to rise from July's 48 to 49, still indicating a contraction. Disappointing data may trigger renewed selling pressure on the U.S. dollar, thereby sustaining gold's record-breaking rally.

      Buy XAUUSD
      EXP
      PENDING

      3435.00

      ENTRY

      3550.00

      TGT

      3380.00

      SL

      3550.78 -8.02 -0.23%

      --

      Point

      PENDING

      3380.00

      SL

      CLOSING

      3435.00

      ENTRY

      3550.00

      TGT
      Fundamentals

      The ISM Manufacturing PMI for August is expected to rise from July's 48 to 49, still indicating a contraction. Given the potential for disappointing data, the U.S. dollar could face fresh selling pressure, which would help maintain gold's historic upward momentum. Additionally, U.S. President Donald Trump continues his efforts to appoint more dovish officials to the Federal Reserve, while ongoing concerns about the central bank’s independence continue to weigh on the U.S. dollar but support gold. Meanwhile, geopolitical developments between Russia and Ukraine also remain in focus, bolstering demand for traditional safe-haven assets like gold. Ukrainian President Volodymyr Zelenskyy stated on Sunday that, following weeks of intense strikes on Russian energy infrastructure, Ukraine plans to launch new attacks on the Russian hinterland. Last week, Trump expressed deep disappointment, particularly in light of his recent attempts to mediate an end to the Russia-Ukraine war.
      The U.S. dollar saw a broad-based short-covering rebound from over one-month lows, driven by profit-taking as traders squared positions ahead of key U.S. business surveys and employment data due this week. With market speculation growing over a significant interest rate cut by the Federal Reserve later this month, the U.S. ISM Manufacturing PMI has also become a focal point. The likelihood of a 25-bps rate cut in September is now fully priced in, with the CME Group's FedWatch Tool showing a probability as high as 90%.

      Technical Analysis

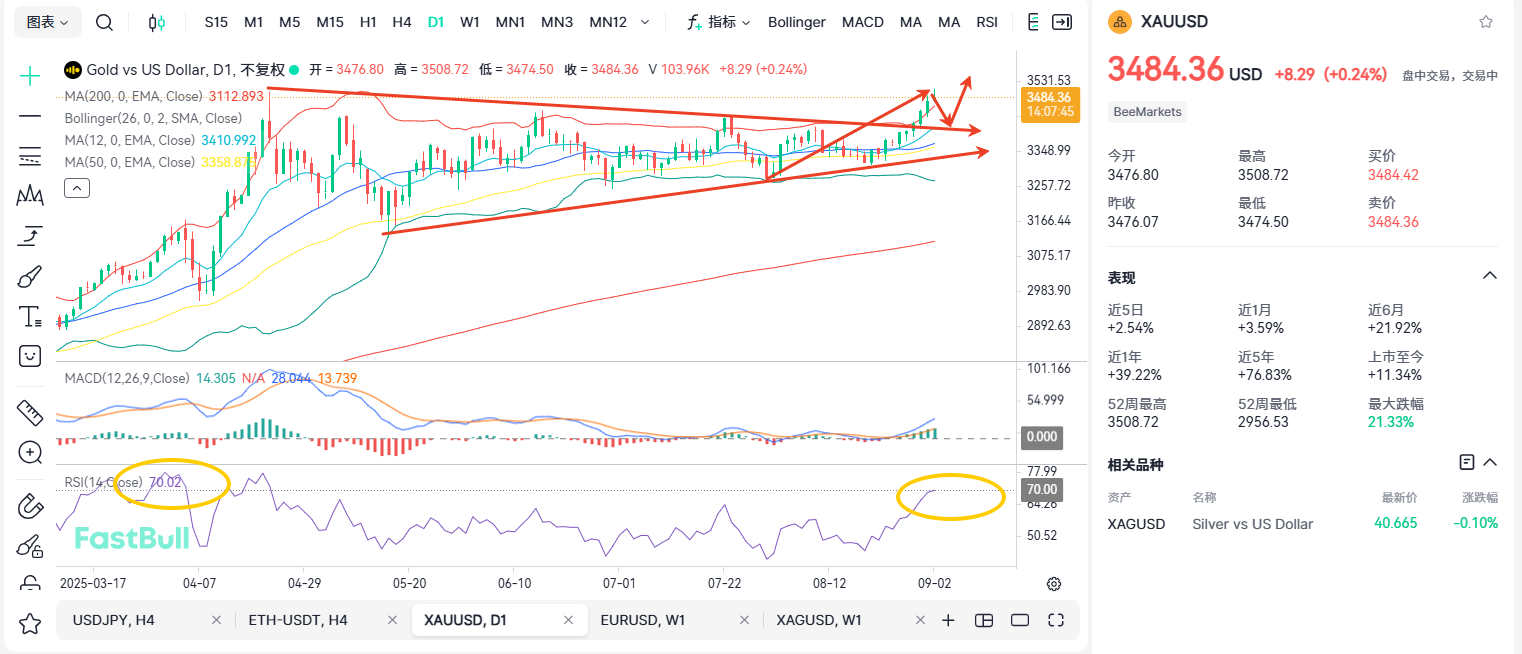
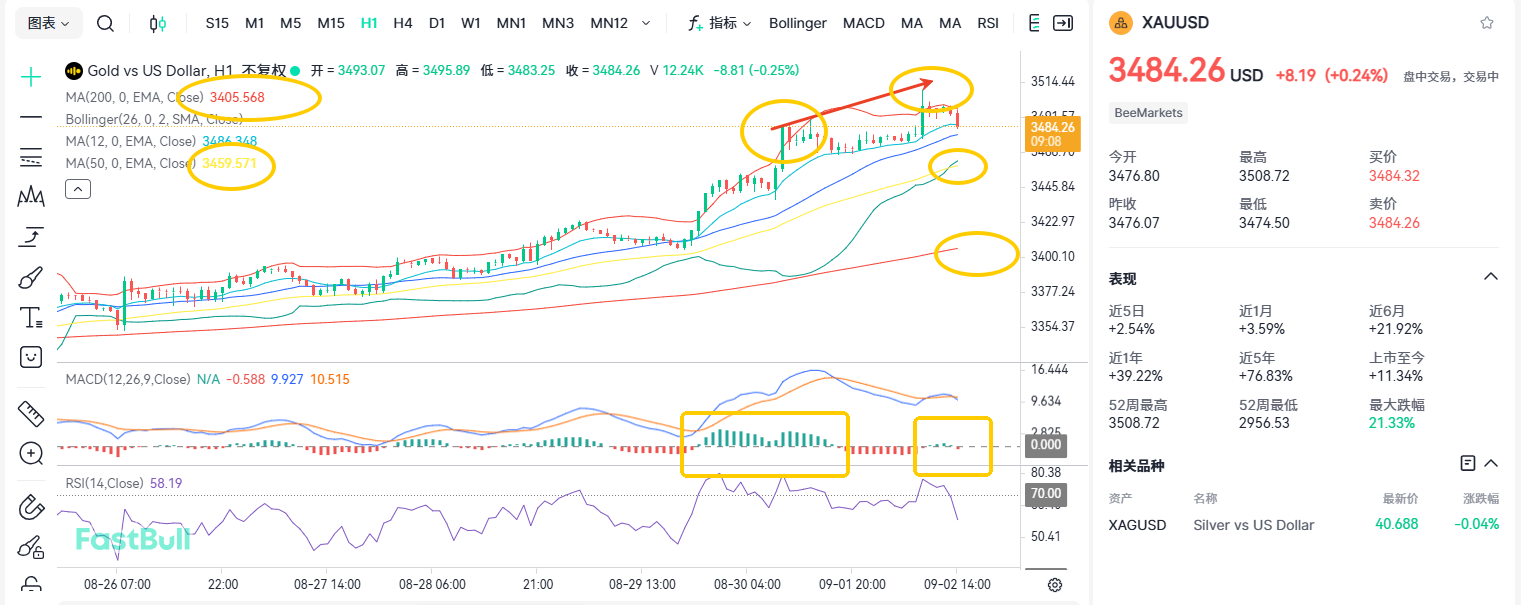
      Based on the one-hour chart, gold broke above the Bollinger Upper Band but encountered resistance and pulled back. It is currently finding support near the Bollinger Middle Band and consolidating. The MACD shows weakening bullish momentum, even as prices are making new highs. Meanwhile, the RSI is forming lower highs (a sign of bearish divergence), suggesting a greater probability of a short-term correction. Key support lies around the EMA50, near the $3,460 level. Regarding the daily chart, after breaking above the upper boundary of the triangle pattern, gold has been rallying strongly along the Bollinger Upper Band. Currently, the Bollinger Bands are expanding upwards, with moving averages sloping upward. The MACD forms a golden cross, and the RSI stands at 70, entering overbought territory. Overall, the price may retest the upper edge of the triangle before breaking out again to the upside. Thus, investors should buy the dips. 
      Triangle Breakout Achieved: Is Gold Heading Straight for $4,000?_1Triangle Breakout Achieved: Is Gold Heading Straight for $4,000?_2

      Trading Recommendations:  

      Trading direction: Buy 
      Entry price: 3435
      Target price: 3550
      Stop loss: 3380
      Support: 3460/3430/3406
      Resistance: 3500/3550/3600
      Risk Warnings and Investment Disclaimers
      You understand and acknowledge that there is a high degree of risk involved in trading with strategies. Following any strategies or investment methodologies is the potential for loss. The content on the site is being provided by our contributors and analysts for information purposes only. You alone are solely responsible for determining whether any trading assets, or securities, or strategy, or any other product is suitable for you based on your investment objectives and financial situation.

      Quick Access to 7x24

      Quick Access to More Editor-selected Real-time News

      Exclusive video for free

      Live Learn project team is dedicated to create exclusive videos

      Real-time Quotes

      View more faster market quotes

      More comprehensive macro data and economic indicators

      Members have access to entire historical data, guests can only view the last 4 years

      Member-only Database

      Comprehensive forex, commodity, and equity market data

      Tank

      Analysts

      20 years of trading experience, specializing in naked price action analysis, Elliott Wave Theory, and Chan Theory. Has conducted in-depth research on forex, stocks, and cryptocurrencies. Achieved a tenfold profit during the 2005 bull market and doubled profits within one month of entering the crypto market in 2015. Adheres to the trading philosophy: "Trend is king; focus on the big picture, act on

      Rank

      6

      Articless

      137

      Win Rate

      37.79%

      P/L Ratio

      1.09

      Focus on

      USDJPY, XAUUSD

      Related Analysis

      A Turning Point Emerges: Is A Meteoric Rise for USDCAD Imminent?​

      Trading

      A Turning Point Emerges: Is A Meteoric Rise for USDCAD Imminent?​

      Trading

      Silver Breaks Through Key Level of 40! Next Target 50?

      Trading

      Silver Breaks Through Key Level of 40! Next Target 50?

      Trading

      Lagarde Issues a Warning! Is the Euro in Jeopardy?

      PENDING
      FastBull
      English
      English
      العربية
      繁體中文
      简体中文
      Bahasa Melayu
      Bahasa Indonesia
      ภาษาไทย
      Tiếng Việt
      Telegram Instagram Twitter Facebook Linkedin
      Copyright © 2023 Live Learn Ltd
      Economic Calendar 7x24 Quotes Video Analysis Data Warehouse Pro AI Signal News User Agreement Privacy Policy About Us

      Risk Disclosure

      The risk of loss in trading financial assets such as stocks, FX, commodities, futures, bonds, ETFs or crypto can be substantial. You may sustain a total loss of the funds that you deposit with your broker. Therefore, you should carefully consider whether such trading is suitable for you in light of your circumstances and financial resources.

      No consideration to invest should be made without thoroughly conduct your own due diligence, or consult with your financial advisors. Our web content might not suit you, since we have not known your financial condition and investment needs. It is possible that our financial information might have latency or contains inaccuracy, so you should be fully responsible for any of your transactions and investment decisions. The company will not be responsible for your capital lost.

      Without getting the permission from the website, you are not allow to copy the website graphics, texts, or trade marks. Intellectual property rights in the content or data incorporated into this website belongs to its providers and exchange merchants.