Crude Oil prices continued to weaken on Friday, extending a sharp two-week decline as traders responded to tentative diplomatic progress between Washington and Tehran that could reduce immediate threats to global energy supplies. West Texas Intermediate (WTI) crude hovered near $86.50 per barrel during European trade after slipping to its lowest level in roughly a month, briefly testing levels below the $86.00 handle.
The latest decline leaves the US benchmark on track for an almost 15% collapse over the past two weeks, marking one of the steepest pullbacks since the latest Middle East conflict erupted earlier this year. The selloff reflects a rapid unwinding of geopolitical risk premium that had previously driven Oil prices sharply higher amid fears of prolonged disruptions to shipping activity in the Strait of Hormuz.
Investor sentiment improved after reports emerged that the United States and Iran had reached a preliminary memorandum of understanding aimed at extending the existing ceasefire arrangement for another 60 days. According to Axios, the proposed framework would allow negotiations surrounding Tehran’s nuclear program to continue while also easing restrictions on maritime traffic through the Strait of Hormuz, one of the world’s most strategically important energy chokepoints.
The development triggered a moderate relief rally across global financial markets, lifting equity futures while simultaneously pressuring traditional safe-haven assets, including the US Dollar. Energy markets, however, reacted with only measured optimism as traders remained cautious about the fragile nature of the negotiations and the significant political hurdles that still remain before a formal agreement can be finalized.
The proposed deal reportedly still requires approval from US President Donald Trump, whose recent comments on Iran have often alternated between diplomatic openness and aggressive rhetoric. That uncertainty continues to prevent investors from fully pricing out geopolitical risks, particularly given the repeated breakdowns in previous negotiations between the two nations.
In my view, the Oil market is beginning to transition away from panic-driven pricing and toward a more balanced assessment of actual supply disruption risks. Earlier in the conflict, traders aggressively bid crude higher on fears that Iran could fully disrupt maritime traffic through Hormuz or target regional energy infrastructure. While those risks have not completely disappeared, the market increasingly appears to believe that neither Washington nor Tehran wants a prolonged escalation capable of destabilizing global energy flows for an extended period.
Still, downside momentum in crude remains somewhat restrained due to ongoing signs of tightening physical supply conditions in the United States. Fresh data released by the US Energy Information Administration (EIA) on Thursday showed that US crude inventories declined by 3.327 million barrels during the week ending May 22. Although the draw was smaller than the roughly 5 million barrels analysts had expected and significantly below the previous week’s massive 7.864 million-barrel decline, it nevertheless marked the fifth consecutive weekly inventory drawdown.
The continued depletion in US stockpiles underscores how resilient underlying demand remains despite growing macroeconomic uncertainties and elevated borrowing costs. It also highlights the lingering effects of months of geopolitical instability, which disrupted supply chains and encouraged precautionary inventory accumulation earlier in the quarter.
That inventory data helped cushion Oil prices from a more severe collapse, particularly as many traders remain wary of re-entering aggressive short positions while tensions in the Gulf region continue simmering beneath the surface.
Broader macroeconomic dynamics are also contributing to the recent weakness in crude. Falling Treasury yields, softer inflation expectations, and improving global risk sentiment have collectively reduced demand for defensive commodities. At the same time, concerns about slowing global growth — particularly in Europe and parts of Asia — continue to cloud the demand outlook for energy consumption heading into the second half of the year.
Technical Analysis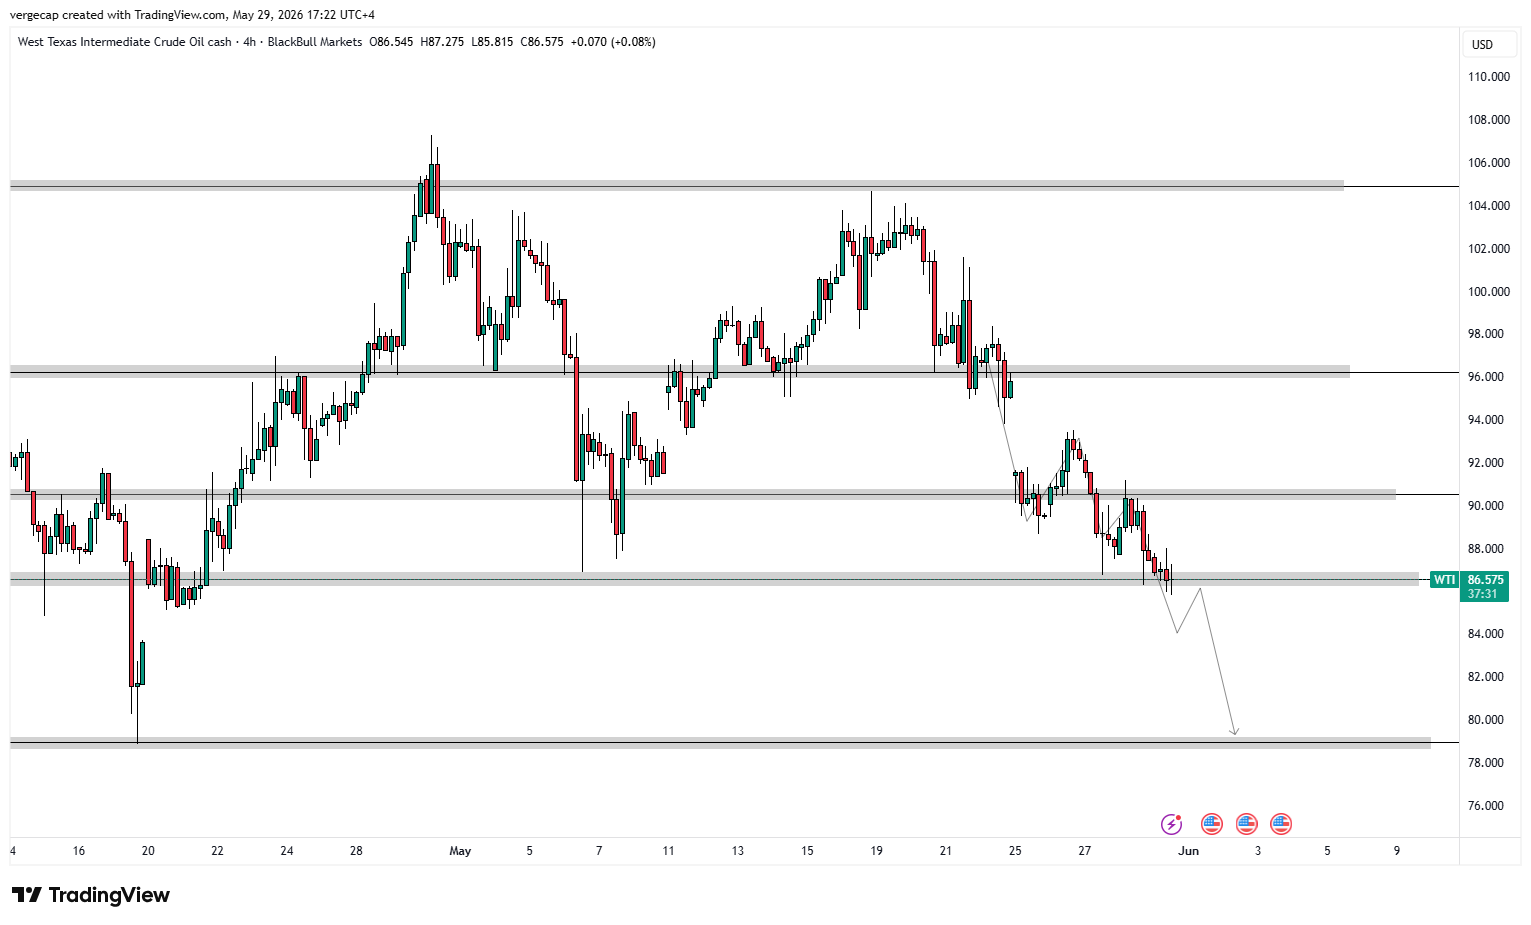
From a technical perspective, WTI crude remains trapped in a firmly bearish structure on the 4-hour chart, with prices extending a sharp breakdown below several key support regions after failing to sustain momentum above the psychologically important $100.00 level earlier in May. The broader market structure now reflects a clear transition from consolidation into an accelerated downside trend, as sellers continue to dominate price action amid fading geopolitical risk premium and deteriorating bullish momentum.
The recent decline below the $96.00 support zone marked a major technical breakdown and confirmed a shift in market sentiment. That level had previously acted as a critical demand area throughout May, but once breached, it triggered aggressive liquidation pressure that sent prices rapidly toward the $90.00 region. The inability of bulls to reclaim lost ground afterward reinforced the bearish outlook and encouraged fresh short positioning.
WTI is now trading just above the key $86.00–$86.50 support zone, an area that previously acted as a significant consolidation floor during late April. Price action around this region remains extremely important in the near term. A decisive breakdown beneath this support cluster would likely confirm continuation of the broader downtrend and expose the next major downside target near the $80.00 psychological handle. That region also aligns with a historically significant support zone visible on the chart and could become a magnet for bearish momentum if selling pressure accelerates further.
The chart structure suggests that crude may attempt a brief corrective rebound before resuming lower. However, unless buyers can reclaim territory above the $90.00 psychological barrier, any recovery is likely to be viewed as a temporary retracement within a broader bearish trend rather than the beginning of a sustainable reversal. The former support zone around $90.00 has now transformed into immediate resistance, while stronger overhead resistance remains positioned near the $96.00 area.
A sustained move back above $96.00 would be required to meaningfully weaken the current bearish structure. Such a recovery could trigger short-covering momentum toward the $100.00–$102.00 region. However, current price action does not yet support that scenario, as lower highs and persistent selling pressure continue to dominate the broader technical landscape.
Momentum indicators continue to favor downside continuation rather than stabilization. The Relative Strength Index (RSI) appears to be hovering near oversold territory, reflecting strong bearish momentum but also signaling the possibility of intermittent short-term rebounds driven by profit-taking. Importantly, RSI has not yet shown convincing bullish divergence, suggesting that underlying selling pressure remains intact.
Meanwhile, the Moving Average Convergence Divergence (MACD) remains deeply below the zero line and continues to widen negatively, reinforcing the view that downside momentum is still accelerating. The absence of any meaningful bullish crossover further strengthens expectations for continued weakness in the sessions ahead.
From a broader perspective, the breakdown from the previous trading range resembles the early stages of a larger bearish continuation pattern. Unless geopolitical developments or unexpected supply disruptions reignite risk premium across energy markets, the path of least resistance appears tilted to the downside.
TRADE RECOMMENDATION
SELL WTI CRUDE OIL
ENTRY PRICE: 86.40
STOP LOSS: 92.20
TAKE PROFIT: 80.00


